DISCLAIMER — Not financial advice. Educational content only, not an offer or solicitation to buy or sell any security. Biotech and small/mid-cap stocks are highly speculative and volatile and can result in a partial or total loss of capital. Do your own research and consult a licensed advisor where appropriate.
Tools I Use
Real-Time Market Scanner
Fast movers • Alerts • Momentum
10% OFF with SAVE10
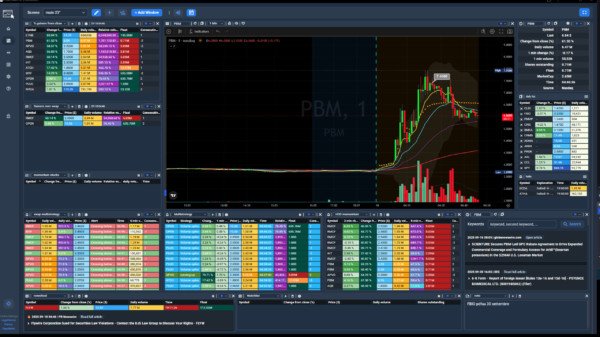

Recommended Platform

Professional Trading Workflow
Charts • Watchlists • Multi-broker tools
Built for active traders

Merlintrader Trading Pub
Biotech catalyst, news and analysis PDUFA tracker
Merlintrader Trading Pub
Biotech catalyst, news and analysis PDUFA tracker
Merlintrader Editorial
Biotech education
Analyst price targets
Updated June 29, 2026
Analyst Price Targets in Biotech: Why the Most Quoted Number Is Often the Least Useful One
A deeper, U.S.-focused Merlintrader editorial on how to read sell-side price targets in small and mid-cap biotech, why 12-month targets often fail as forecasts, and why binary events such as PDUFA dates, Phase 3 readouts and FDA advisory committees can turn the “average target” into a misleading comfort number.
The thesis in plain English
The 12-month analyst price target is one of the most repeated numbers in retail finance. It appears in headlines, brokerage apps, social-media screenshots, financial television segments and stock forums. It looks clean, objective and authoritative. The problem is that, especially in biotech, it is often the wrong number to lean on.
A price target is not useless. Good analysts can add real value by breaking down mechanism of action, trial design, regulatory path, commercial opportunity, competitive positioning, balance sheet constraints and probability of success. But the final price target printed at the top of a note is usually a compressed output from a model full of assumptions. It is not a promise. It is not a forecast in the way many retail investors read it. It is not a clean probability-weighted trading plan.
The distinction matters because small and mid-cap biotech stocks are frequently driven by events that do not move gradually. A PDUFA decision, FDA complete response letter, advisory committee vote, Phase 3 readout or safety update can collapse uncertainty in a single session. Before the event, the stock may be pricing a blend of success and failure. After the event, the stock no longer needs the blend. It reprices toward the outcome.
Merlintrader framing: in biotech, the target price should be read as a map of analyst assumptions, not as the destination. The real work is not asking “what is the upside to the target?” but “what scenario does this target assume, what probability does it imply, and what happens if the binary event breaks the other way?”
The data problem: targets are less accurate than headlines imply
The academic evidence on target-price accuracy is not flattering. Different studies use different samples and definitions, so the exact number changes. That is precisely the point: target-price accuracy depends heavily on what “hit” means. Did the stock close at the target exactly 12 months later? Did it merely touch the target at any point during the period? Was the target adjusted after new information arrived? Was the analyst independent, affiliated with investment banking, or covering a stock with thin liquidity?
Older U.S. evidence by Bradshaw and co-authors found that target prices were met on average only about 24% to 45% of the time, depending on the definition of accuracy. Kerl and Walter found that 56.53% of targets in their German sample were achieved within the 12-month period. Bradshaw, Brown and Huang’s international evidence found that roughly 64% of target prices were met at some point during the 12-month horizon, while end-of-period accuracy was much lower. European research using Bloomberg 12-month consensus target prices found that those targets were not accurate forecasts of future market prices.
That mix of findings creates a more honest range than the usual headline. If “hit” means “the stock touched the target once,” the number can look respectable. If “hit” means “the target was a useful one-year forecast,” the picture gets much worse.
Strict accuracy~24–45%Bradshaw-style evidence shows that target prices are met far less often when accuracy is measured more strictly.
Touched during period~55–64%The rate improves when a stock only needs to touch the target at least once within the 12-month window.
Forecast qualityWeakEuropean consensus target-price research found no reliable predictive power over future market prices.
Why this matters: “target reached” is not the same as “target was a good forecast.” A stock can briefly spike to a target during a volatile event window and still close the year far away from it. That distinction is critical in biotech, where intraday and event-window volatility can be extreme.
The biotech twist: a single target tries to flatten two incompatible futures
Biotech makes the target-price problem worse because many companies are not valued primarily on current earnings. They are valued on future clinical, regulatory and commercial possibilities. A pre-revenue oncology platform, a rare-disease developer waiting on an FDA decision or a renal-disease company preparing for launch has a valuation that depends on events not yet resolved.
Before a binary catalyst, the market may be pricing a probability-weighted blend. Suppose a company trades at $10 ahead of a PDUFA date. One plausible approval scenario could be $24 if the label is clean and launch financing is manageable. One plausible rejection scenario could be $3 if the FDA issues a complete response letter and the company needs more capital. If the market assigns a 35% chance to the $24 scenario and a 65% chance to the $3 scenario, the rough expected value is close to $10. That does not mean the stock is expected to trade calmly at $10 after the decision. It means the market is waiting for the coin to land.
A single analyst target at $18 can be deeply misleading in that setup. It may sound like an 80% upside forecast from a $10 price. In reality, it may be closer to a success-case valuation, or a blended valuation using assumptions that are not visible in the headline. The reader sees the target. The model sees the assumptions. The stock sees the FDA decision.
| Pre-event item | What retail often sees | What the analyst model may contain | What actually drives the stock |
|---|---|---|---|
| Current price | “The stock is at $10.” | A probability-weighted blend of success, failure, cash runway and dilution assumptions. | The market’s current balance between hope, fear, liquidity and event timing. |
| 12-month target | “The target is $18, so upside is 80%.” | A DCF or sum-of-the-parts output with success probability, peak sales, launch timing and discount rate assumptions. | The next material catalyst may make the model obsolete in one day. |
| Approval scenario | “Good news should move the stock up.” | Label quality, addressable population, reimbursement, CMC obligations and launch funding. | The stock may still sell off if the approval was priced in or the label disappoints. |
| Failure scenario | “Bad news is already partly priced in.” | Residual pipeline value, cash per share, debt, trial redo cost and dilution risk. | A CRL or failed trial can reset the entire capital structure. |
Why PDUFA, AdCom and Phase 3 readouts break the 12-month target
The 12-month target sounds like a time-based forecast. Biotech catalysts are usually event-based. That mismatch is the core problem.
A PDUFA date does not wait politely for the 12-month horizon. An advisory committee briefing document can reset a stock before the formal vote. A Phase 3 readout can destroy years of valuation work in a morning press release. A safety signal can change the risk-benefit calculation even if efficacy looks statistically significant. A manufacturing issue can derail an otherwise attractive clinical package. A label restriction can turn an apparent approval into a disappointing commercial setup.
That is why a biotech target price often behaves less like a forecast and more like a scenario marker. It can tell the reader what the analyst believes the company may be worth under certain assumptions. But it cannot make the binary event less binary.
PDUFA risk
A decision date can resolve approval status, but the headline is only the first layer. Label language, REMS, post-marketing requirements, manufacturing comments, launch timing and cash needs can matter just as much.
AdCom risk
Advisory committees can move stocks before the vote through briefing documents, FDA questions and panel tone. The market often reprices the debate before the formal recommendation appears.
Readout risk
A Phase 3 win is not simply “positive” or “negative.” Investors must examine effect size, durability, safety, subgroup consistency, endpoint hierarchy and regulatory relevance.
Financing risk
A successful catalyst can still be followed by dilution. A failed catalyst can make dilution more punitive. The price target rarely captures the timing and terms of future capital raises cleanly.
The uncomfortable truth: right before a major binary event, the “average target” can be the one price the stock is least likely to trade at after the news. The post-event price usually moves toward one branch of the tree, not the midpoint.
Why optimism is structural, not accidental
Optimistic target prices are not just the result of bad modeling. The research ecosystem has incentives. Analysts need access to management teams. Brokerage firms want research that clients read. Investment banks compete for corporate relationships. Research departments operate under regulatory rules, but conflicts of interest do not disappear just because they are disclosed and managed.
The SEC’s investor education materials remind investors to look at analyst recommendations carefully and note that rules prohibit analysts from offering favorable ratings or specific price targets to induce investment banking business. FINRA’s current research analyst rule framework is designed to identify and manage conflicts around equity research, including separation between research and investment banking and required conflict disclosures. Those safeguards matter. They do not mean every price target is neutral, perfectly calibrated or useful as a trading forecast.
Small-cap biotech magnifies the problem. Coverage can be thin. A single new target can dominate the visible consensus. Some companies are capital-market dependent. Many are loss-making and need repeated financings. A report can use legitimate valuation methods and still rely on aggressive assumptions for probability of success, peak sales, launch uptake, pricing, market share, dilution, trial cost and time to profitability.
| Source of optimism | Why it appears in biotech | How a reader should respond |
|---|---|---|
| Success-case framing | The product story is easier to sell than the probability tree. | Ask whether the target is closer to a success case than a probability-weighted case. |
| Peak-sales assumptions | Rare-disease and oncology markets can support high theoretical pricing. | Check the eligible population, adoption curve, payer barriers and competing therapies. |
| Probability of success | Analysts may assign probabilities that look reasonable but dominate the valuation. | Sensitivity-test the target by lowering probability of approval or launch success. |
| Capital-market dependence | Pre-commercial companies often need fresh cash after catalysts. | Model share count, cash runway and likely financing windows, not just enterprise value. |
| Thin consensus | Only a few analysts may cover the company. | Do not treat a three-analyst average like a deep institutional consensus. |
Dispersion: the hidden warning inside consensus targets
Retail dashboards often show a “consensus target” as if it were a single piece of information. In biotech, the spread between the lowest and highest target can be more informative than the average. If one analyst has a $4 target and another has a $28 target, the $16 average does not describe consensus. It describes disagreement.
Wide dispersion usually means the market is not debating a small difference in margin assumptions. It is debating the existence of the company’s future. One side may be underwriting approval, a broad label and a clean launch. The other side may be underwriting regulatory failure, delay, dilution or commercial disappointment. Averaging those views creates a tidy number, but tidy is not the same as useful.
Practical rule: when the target range is wider than the current stock price, do not quote the average target as “upside.” Quote it as evidence that the market has not agreed on the future state of the company.
Dispersion also matters around revisions. If multiple analysts raise targets after a catalyst, the move may confirm changing assumptions. If one analyst raises a target while others stay silent, the signal is weaker. If targets are repeatedly cut after dilution, delayed timelines or label uncertainty, the old average can become stale faster than retail platforms update it.
What analysts can still do well
A strong biotech analyst can still be extremely useful. The issue is not the existence of research. The issue is reducing research to a target price. A good note can help investors understand the scientific rationale, comparator drugs, trial powering, endpoint hierarchy, FDA precedent, patient population, label expansion path, reimbursement risks and commercial infrastructure. Those pieces can be valuable even when the target price is wrong.
The best use of sell-side research is to reverse-engineer the model. What peak sales are assumed? What probability of success is embedded? What discount rate is used? Is the target based on net present value, enterprise value to sales, comparables, sum-of-the-parts or a post-approval multiple? How much cash burn is expected before launch? How much dilution is assumed? What happens if the launch is delayed by one year?
| Useful analyst output | Why it matters | How not to misuse it |
|---|---|---|
| Trial-design analysis | Helps assess whether an endpoint is likely to be clinically and regulatorily meaningful. | Do not assume a well-designed trial guarantees a positive outcome. |
| Regulatory precedent | Shows how FDA has treated similar endpoints, indications or accelerated approval requests. | Do not assume precedent applies cleanly when the dataset or agency context differs. |
| Commercial model | Forces assumptions around patient count, pricing, uptake and competition. | Do not confuse theoretical peak sales with reachable net revenue. |
| Cash runway analysis | Shows whether the company can reach the next catalyst without financing. | Do not ignore dilution simply because the target price is high. |
| Sensitivity tables | Reveal which assumptions control most of the valuation. | Do not focus only on the base case when downside cases are asymmetric. |
The Merlintrader framework: how to read a biotech target price
Instead of treating a target price as a destination, treat it as the first line of a due-diligence checklist. The target is not the answer. It is an invitation to ask better questions.
Step 1ScenarioIdentify whether the target reflects a success case, base case, probability-weighted case or post-approval rerating case.
Step 2AssumptionsExtract peak sales, probability of success, discount rate, launch timing, cash burn and share-count assumptions.
Step 3Event mapPlace the target against the next catalyst: PDUFA, AdCom, readout, financing, partnership or commercial launch.
- Check the date of the report. A target published before new dilution, a trial delay, an FDA briefing document or a market selloff may no longer be useful.
- Check the number of analysts. A “consensus” based on two or three firms is not the same as a robust institutional consensus.
- Check dispersion. A wide spread between high and low targets is a risk signal, not a hidden guarantee of upside.
- Check the cash runway. If the company needs capital before or shortly after the catalyst, the target may overstate per-share value.
- Check the catalyst sequence. Approval may be followed by launch risk; positive Phase 2 may still require Phase 3; an AdCom vote may still leave final FDA discretion.
- Check what would falsify the target. A good model should make clear which events would force a reset.
A simple probability tree beats a lazy target
For catalyst-driven biotech, a simple probability tree is often more useful than a single target. It does not need to be perfect. It only needs to force the reader to think in branches instead of headlines.
| Branch | Question to ask | What can move the stock | Why the target may fail |
|---|---|---|---|
| Clean approval | Is the label broad enough to support the commercial model? | Label, launch timing, inventory, reimbursement, salesforce, partnership interest. | The target may still be too high if launch economics are weaker than expected. |
| Approval with restrictions | Does the label narrow the patient population? | Safety language, monitoring burden, REMS, post-marketing obligations. | The target may have assumed a cleaner label and larger addressable market. |
| Delay | Is the delay administrative, CMC-related or clinical? | Cash runway, burn rate, regulatory timeline and confidence in resubmission. | The target may not reflect the time value and dilution from a delayed launch. |
| Complete response letter | Can the issue be fixed without a new trial? | Need for new data, manufacturing remediation, financing and credibility. | The target may collapse if the prior model assumed near-term revenue. |
| Failed readout | Is there residual pipeline value? | Cash per share, other assets, strategic alternatives and runway. | The target may become irrelevant if the lead asset drove most valuation. |
This is the mental model that should sit behind every biotech target-price screenshot. A one-line target tells you nothing about branch probability, event timing or downside severity. A probability tree forces the question that matters: “What does the stock look like if the next catalyst does not validate the target?”
Common retail mistakes with biotech targets
| Mistake | Why it is dangerous | Better approach |
|---|---|---|
| Quoting the average target as guaranteed upside | The average may blend incompatible success and failure scenarios. | Show the low, average and high target together with catalyst timing. |
| Ignoring the report date | Old targets can survive on data platforms long after the thesis changed. | Use the most recent report date and check whether major events occurred since publication. |
| Ignoring share count | Biotech targets can be destroyed by dilution even when enterprise value improves. | Model fully diluted share count and likely financing windows. |
| Using targets after binary events without adjustment | Approval, CRL or readout results can invalidate pre-event models instantly. | Reset the valuation after the event rather than relying on stale consensus. |
| Reading high targets as institutional conviction | High targets may reflect aggressive assumptions rather than broad conviction. | Look for repeated upgrades, increasing coverage quality and detailed assumption support. |
| Confusing clinical promise with commercial value | A therapy can be scientifically interesting and commercially difficult. | Evaluate pricing, reimbursement, standard of care, competition and launch infrastructure. |
Where target prices can be most misleading: small and mid-cap biotech
The risk is not evenly distributed across the market. Large profitable pharmaceutical companies may have diversified earnings streams, multiple approved products, global commercial infrastructure and deep analyst coverage. A 12-month target for a large pharma stock can still be wrong, but the company’s valuation is usually not determined by one FDA decision.
Small and mid-cap biotech is different. The lead asset can represent most of the enterprise value. The company may have no product revenue. Cash runway may depend on the stock price. The next catalyst may decide whether the company raises capital from strength or weakness. A single FDA letter can change not just valuation, but survival odds.
This is why target prices in small biotech often look spectacular before catalysts. The upside scenario is clean and visible. The downside scenario is messier: dilution, delays, new trials, staff cuts, strategic alternatives, partner renegotiation and loss of credibility. A target price can handle that complexity only if the reader opens the model. The headline number cannot.
Red flag: when a pre-commercial biotech trades far below the average target, that gap does not automatically mean the market is irrational. It may mean the market is assigning a lower probability of success, a larger dilution discount, a narrower label, slower uptake or higher financing risk than analysts assume.
The useful version of a price target
The best version of a price target is not the number itself. It is the set of assumptions beneath it. A serious investor or trader should want the model, not the headline.
Use the target as a sentiment gauge
A rising target can show that analysts are becoming more confident. A falling target can show that assumptions are being cut. The direction and speed of revisions often matter more than the absolute number.
Use the target as an assumption checklist
Ask what peak sales, success probability, launch timing and dilution assumptions would be required to justify the target. If those assumptions look stretched, the target is fragile.
Use the target as a disagreement meter
Wide dispersion is a signal. It tells you analysts are not valuing the same future. That is not consensus; it is uncertainty wearing a neat label.
Use the target as a post-event reset point
After a catalyst, compare revisions to the actual outcome. The speed and magnitude of changes can reveal whether the old target was realistic or just a pre-event anchor.
Merlintrader bottom line
Analyst price targets are not garbage. They are just badly used. In biotech, the target price becomes dangerous when it is quoted without the probability tree, without the cash runway, without the event calendar, without the label assumptions and without the dispersion between analysts.
The clean framework is simple: do not ask whether a stock has upside to the average target. Ask what world must exist for that target to be reasonable. Ask whether the next catalyst can validate or destroy that world. Ask whether the company can finance itself if the world is delayed. Ask whether the label, market size and competitive landscape support the model. Ask whether the target is fresh or stale. Ask whether the analyst has explained the risk factors that could block the target.
For catalyst-driven biotech, a target price is a starting point, not a conclusion. It can help readers understand assumptions and sentiment. It cannot replace regulatory analysis, clinical judgment, capital-structure work or risk discipline. The number is loud because it is simple. The reality is messy because biotech is binary, capital-intensive and unforgiving.
The most useful habit is to stop treating the target as a forecast and start treating it as evidence. Evidence of analyst sentiment. Evidence of embedded assumptions. Evidence of disagreement. Evidence of how the market wants to frame the story. Once you do that, the target becomes useful again — not because it predicts the future, but because it shows how fragile the market’s story may be.
Practical checklist before sharing a biotech price target
- What is the date of the analyst note or target update?
- How many analysts are included in the average?
- What is the spread between the low target and the high target?
- Is the company pre-commercial, early commercial or already profitable?
- What is the next binary catalyst and when does it occur?
- Does the target assume approval, a clean label, broad reimbursement or fast uptake?
- How much cash does the company have and how long is the runway?
- Is dilution likely before or after the catalyst?
- What happens if the FDA asks for more data, a manufacturing fix or a new trial?
- Has the target been revised after the latest data, FDA communication or financing event?
Best reader discipline: never post an average target alone. Post the date, the low/high range, the number of analysts, the next catalyst, the cash runway and the main assumption that could break the target.
Primary Sources and Further Reading
- Bradshaw, Brown and Huang / University of Minnesota — Differential Target Price Forecasting Ability
- Kerl & Walter — Target Price Accuracy
- The Accounting Review — Target Price Accuracy: International Evidence
- Journal of Risk and Financial Management — Accuracy of European Stock Target Prices
- Bonini, Zanetti, Bianchini and Salvi — Target Price Accuracy in Equity Research
- Clinical trial event-study evidence — The reaction of sponsor stock prices to clinical trial outcomes
- SEC Investor Education — Analyzing Analyst Recommendations
- FINRA — Research Analyst Rules
- FINRA Rule 2241 — Research Analysts and Research Reports
Track the catalyst, not just the target
For biotech, the next FDA date, advisory committee, readout or financing window can matter more than the average analyst target. Follow Merlintrader’s biotech catalyst calendar to keep the event map in front of the price narrative.
Open the Biotech Catalyst Calendar→Educational disclaimer: this content is for informational and educational purposes only. It is not financial advice, investment advice, trading advice, legal advice, tax advice, a research report, or a recommendation to buy, sell or hold any security. Biotech stocks can be highly volatile and may involve clinical failure, regulatory rejection, financing risk, dilution, commercial execution risk and significant share-price movement around FDA events, clinical data, advisory committee meetings and PDUFA dates.
Analyst price targets, ratings, earnings estimates, market opinions and valuation scenarios are not guarantees of future performance. Readers should review official company filings, FDA materials, primary clinical data, analyst disclosures and independent sources, and should consult qualified professionals before making financial decisions.
Merlintrader may discuss securities for educational and editorial purposes. All scenarios, interpretations and frameworks are general market commentary, not personalized investment recommendations.