AI transparency: articles and reports are produced with the help of artificial intelligence and checked through a process that does not constitute specialist validation. They may contain errors: verify relevant information with independent sources. Read the full disclaimer.
Merlintrader research directory · Non-biotech
Small and Mid Caps: $SPNT, $SPSC, $AVT and $BB
Week of September 28–October 2, 2026. A more selective non-biotech watchlist: three relative-strength candidates, two event-led cases that still need confirmation, and a candid audit of the previous technical selection. The question is where company evidence and market behaviour agree—not which stock can be promised a green week.
Research published September 25, 2026, before the U.S. regular session. Price cutoff: September 24 close. Forward window: September 28–October 2. Friday September 25 is not included in the performance audit or charts. Premarket prices are not substituted for completed daily candles.
IWM closed at $281.66, below SMA20 $289.50 and SMA50 $294.28. MDY closed at $663.74, also below both averages. SPY at $767.18 remained above its corresponding averages. From August 24 to September 24, price returns were IWM −5.47%, MDY −4.42% and SPY +0.49%. This is weak small/mid-cap participation, not a broad small-cap tailwind. These ETFs are market-segment proxies, not index total-return series.
The Federal Reserve raised its target range by 25 basis points to 3.75–4.00% on September 16. The coming PCE inflation report, manufacturing survey and employment report can therefore overwhelm a company-specific setup. A softer inflation reading could help rate-sensitive shares; firmer inflation could pressure valuations. Weak employment can also damage demand expectations, so a weak report is not automatically bullish. Federal Reserve, September 16.
Editorial conclusion: SPNT, SPSC and AVT combine relative strength with identifiable operating businesses and rising intermediate averages. Their weaknesses are different: SPNT has not held its intraday breakout, SPSC lacks strong volume confirmation, and AVT is extended. BB and EFOR have fresh company developments but weaker confirmation; they are separated from the three technical candidates. No numerical probability of a rise is claimed.
Three technical candidates and two conditional event cases
September 28–October 2 · closes through September 24
The primary screen returned 193 liquid small/mid-cap names meeting its snapshot filters; 49 healthcare names were outside this non-biotech remit, leaving 144 discovery candidates. Deeper daily-price work covered 37 individual equities and three benchmark ETFs, including the complete previous 17-name edition, company-event candidates and alternatives. Five cases are developed below. This is a documented editorial funnel, not an exhaustive market ranking or a validated forecasting model.
September 24 SUNet extension and price near SMA20; a contract ceiling is not funded revenue.
The green or red change describes the period before this edition, not the expected result next week. Historical relative strength is a filter, not evidence that next week must be positive. The fixed forward comparison for this edition is September 25 close to October 2 close, against IWM over the same interval. Those closes are not yet available. All five names must remain in that audit, with the three technical candidates and two conditional cases reported separately; a failed or unconfirmed case is not removed retrospectively.
Three technical candidates: evidence, confirmation and failure conditions
$SPNT · SiriusPoint
Technical candidate: Relative strength in specialty insurance, with a failed intraday breakout to resolve
September 24 close $25.80 · SMA20 $24.61 · SMA50 $24.27 · volume/prior20 2.40× (IBKR series)
Business evidence and why now. SiriusPoint provides a different source of operating risk from miners, tankers and semiconductor names. Its July 29 second-quarter release reported $69 million of common net income and 6% growth in core gross premiums. The core combined ratio was 91.4%, below the 100% underwriting break-even reference, although weaker than 89.5% a year earlier. The first-half ratio improved to 90.1% from 92.4%. These are profitable insurance operations, but the latest quarter was not an uninterrupted acceleration. Common-share repurchases reached $95 million by July 28; that is historical capital return, not guaranteed buying next week. No material company event has been verified for September 28–October 2: the weekly thesis is technical persistence supported by the existing business.
What the price confirms—and what it does not. The September 24 close of $25.80 was above SMA20 $24.61 and SMA50 $24.27. The 50-session average had risen only 0.32% over ten sessions, so the intermediate trend is positive but shallow. The stock gained 4.24% from September 18 while IWM fell 0.86%. Participation was above its prior-20-session norm in both checked feeds: 2.40× in IBKR and 1.65× in Finviz. However, the session traded up to $26.50 and then closed below the earlier $26.16 high. That is a rejected intraday advance, not a completed breakout.
What would strengthen the case. A subsequent close above the $26.16–26.50 observed resistance area, followed by acceptance rather than an immediate reversal, would strengthen the continuation case. Holding the $24.61–24.27 moving-average area while relative strength stays positive would preserve the less aggressive consolidation interpretation. The case does not depend on a forecast that yields must fall, or on an unverified analyst price target.
What would weaken or invalidate the case. Repeated closes below the moving-average area would weaken the technical advantage; a break of the observed $23.93 ten-session low would invalidate this particular consolidation. Catastrophe losses, reserve deterioration, weaker underwriting pricing and investment-portfolio losses can override the chart. Q2 core underwriting income declined to $55 million from $67.6 million, so the premium-growth headline must not be mistaken for rising profitability in every period. Market strength has not established that the stock is undervalued.
Observed reference range: prior-20-session high $26.16; latest 10-session low $23.93. ATR14 $0.63 (2.44% of the close). These describe the chart, not an entry, stop order or price objective. No company event on September 28–October 2 is assumed unless explicitly listed.
SPNT · 60 regular sessions · USD
Blue: SMA20. Purple: SMA50 (starts only when 50 observations are available). Candles: green close ≥ open; red close < open. Lower bars: IBKR reported volume, scaled to the chart maximum. No future prices or projected returns. On small screens, scroll the chart horizontally.
Source: IBKR daily RTH TRADES; Merlintrader calculations. Prices through September 24, 2026.
$SPSC · SPS Commerce
Technical candidate: A relatively unextended recovery, supported by recurring revenue but awaiting stronger demand for the shares
September 24 close $82.69 · SMA20 $81.88 · SMA50 $76.19 · volume/prior20 0.61× (IBKR series)
Business evidence and why now. SPS Commerce connects retailers and suppliers through supply-chain software. On September 15 it announced general availability of MAX, initially for Fulfillment and Visibility Management. The commercial product milestone is verified; the company did not quantify incremental MAX revenue. July 30 Q2 results reported revenue of $197.8 million, up 6%, and adjusted EBITDA of $66.6 million, up 19%. Recurring revenue also grew 6%. The September product release supplies current context, while the actual one-week case remains a technical consolidation—not an assumed results announcement or an AI revenue forecast.
What the price confirms—and what it does not. At $82.69 the stock was just 0.99% above SMA20 $81.88, while SMA50 stood at $76.19 and had risen 5.71% over ten sessions. The September 18–24 gain of 3.70% exceeded IWM by 4.56 percentage points. That gives the case a measurable trend advantage without the large short-term extension of AVT or BB. The important weakness is participation: September 24 IBKR volume was only 0.61× its previous 20-session average. Price stabilization is visible; a strong new accumulation signal is not.
What would strengthen the case. Repeated closes above the short average, followed by a recovery toward the observed $89.44 twenty-session high with better participation, would improve the evidence. A break above that prior high would be a new observation to verify, not an outcome presumed by the chart. Further disclosures of customer adoption and monetization would matter more than repeating the general AI theme. Neither management nor this analysis supplies a dated revenue catalyst for the coming week.
What would weaken or invalidate the case. A loss of $81.88 would weaken the short-term consolidation; the observed $77.06 ten-session low is the more important failure reference for this setup. Q2 GAAP EPS fell to $0.19 from $0.52, partly reflecting a $23.45 million loss on the sale of the 3P Revenue Recovery business. The disposal removes about $10.5 million from expected second-half revenue; management expected an approximately neutral adjusted-EBITDA effect. Cash was $173.17 million at June 30. Buybacks do not eliminate dilution: the 10-Q also discloses outstanding equity awards and options. Slow growth or weak AI monetization could limit the re-rating even if the product works.
Observed reference range: prior-20-session high $89.44; latest 10-session low $77.06. ATR14 $3.20 (3.87% of the close). These describe the chart, not an entry, stop order or price objective. No company event on September 28–October 2 is assumed unless explicitly listed.
SPSC · 60 regular sessions · USD
Blue: SMA20. Purple: SMA50 (starts only when 50 observations are available). Candles: green close ≥ open; red close < open. Lower bars: IBKR reported volume, scaled to the chart maximum. No future prices or projected returns. On small screens, scroll the chart horizontally.
Source: IBKR daily RTH TRADES; Merlintrader calculations. Prices through September 24, 2026.
$AVT · Avnet
Technical candidate · extension risk: An electronics-distribution upcycle with strong price leadership and a demanding cash-flow test
September 24 close $100.91 · SMA20 $93.57 · SMA50 $91.89 · volume/prior20 1.65× (IBKR series)
Business evidence and why now. Avnet’s August 5 release reported fiscal Q4 sales of $8.295 billion, up 47.7% year over year and 16.5% sequentially, with adjusted EPS of $2.28 versus $0.81. Management guided the next quarter to $9.0–9.3 billion of revenue and $2.80–2.90 adjusted EPS. This gives the semiconductor and components narrative a specific link to distribution sales and earnings. The quarter ends October 3; that is not a scheduled earnings release. No new company event has been verified inside September 28–October 2. The case is continuation of a disclosed operating upcycle, contingent on price behaviour and the October 1 manufacturing reading.
What the price confirms—and what it does not. The $100.91 close was above SMA20 $93.57 and SMA50 $91.89, with the intermediate average up 2.57% over ten sessions. August 24–September 24 price performance was +16.98%, versus IWM −5.47%. September 24 IBKR volume was 1.65× normal. These are stronger momentum observations than a stock merely bouncing below falling averages. The cost of that strength is extension: the close was 7.84%, or about 1.94 ATR, above SMA20. A favourable narrative may already be substantially reflected in the price.
What would strengthen the case. A stable consolidation that absorbs the recent advance, or a close above the observed $102.70 twenty-session high with sustained participation, would add evidence. A large opening gap without follow-through would not. The operational question remains whether growing shipments turn into cash as inventories and receivables normalize. No assumption is made about quarter-end fund flows or compulsory institutional buying.
What would weaken or invalidate the case. A rapid loss of the recent range and then the $93.57–91.89 average area would weaken momentum; the $90.90 ten-session low is the structure’s lower observed reference. The financial caveat is material: fiscal 2026 operating cash flow was negative $280.9 million, while June 27 debt was $3.213 billion against $155.4 million cash. A $650 million convertible creates potential dilution above its conversion economics. The August $550 million note financing was intended for refinancing; it cannot simply be added to June debt as a net increase. The 10-K also disclosed a $375 million variable-rate term loan entered into in August, maturing in July 2028. The June debt balance is therefore not a current pro-forma debt total. This is a leveraged distributor benefiting from stronger demand, not a cash-rich defensive semiconductor proxy.
Observed reference range: prior-20-session high $102.70; latest 10-session low $90.90. ATR14 $3.79 (3.75% of the close). These describe the chart, not an entry, stop order or price objective. No company event on September 28–October 2 is assumed unless explicitly listed.
AVT · 60 regular sessions · USD
Blue: SMA20. Purple: SMA50 (starts only when 50 observations are available). Candles: green close ≥ open; red close < open. Lower bars: IBKR reported volume, scaled to the chart maximum. No future prices or projected returns. On small screens, scroll the chart horizontally.
Source: IBKR daily RTH TRADES; Merlintrader calculations. Prices through September 24, 2026.
Two event-led candidates with additional confirmation required
Fresh news earns attention, but it does not erase a damaged intermediate trend or a weak response to the announcement. These two names are conditional research cases and carry a higher uncertainty label.
$BB · BlackBerry
Conditional event case: Fresh earnings and a QNX design win, with unusually strong volume but an unrepaired intermediate trend
September 24 close $8.73 · SMA20 $8.00 · SMA50 $8.34 · volume/prior20 3.88× (IBKR series)
Business evidence and why now. BlackBerry supplied two specific developments: on September 22, Coretura became the first QNX/Vector Alloy Kore design win, representing more than $100 million of royalty backlog; on September 24, fiscal Q2 revenue reached $163.3 million, up 26%, including 27% QNX growth. Management raised fiscal 2027 revenue guidance to $616–636 million and expected operating cash flow of approximately $115 million. The royalty backlog is future business, not immediate revenue. The next week’s question is whether investors continue to absorb these newly disclosed operating facts after the initial earnings reaction.
What the price confirms—and what it does not. The September 24 close of $8.73 was near the day’s $8.80 high after a $7.93 low. The stock gained 9.26% from September 18 and closed above both averages. Relative volume was 3.88× in the IBKR series and 3.87× using Finviz history: the demand signal is supported by both vendors. Nevertheless, SMA50 had fallen 7.05% over ten sessions and the stock was already 9.12% above SMA20. A strong one-day response is not the same as a repaired intermediate trend.
What would strengthen the case. Holding the post-results $7.93–8.80 range and then establishing closes above $8.80, followed by the earlier $9.22 high, would strengthen the continuation interpretation. Failure to retain the earnings reaction would make the headline less useful. These levels describe what would need to be observed; no automatic follow-through from an earnings beat is assumed, and no unverified consensus estimate is used.
What would weaken or invalidate the case. A sustained return below the $8.34–8.00 averages, or a loss of the $7.93 earnings-session low, would undermine the immediate event thesis. The longer ten-session low is $7.46. Licensing contributed $22.1 million in Q2, versus about $6 million guided for Q3; next-quarter revenue guidance of $143–154 million is below Q2. Secure communications dollar-based net retention was 91%. At August 31, cash and investments of $447.1 million included $14.1 million restricted cash, alongside $197.1 million of notes. A lumpy licensing quarter and equity dilution remain relevant despite the stronger QNX narrative.
Observed reference range: prior-20-session high $9.22; latest 10-session low $7.46. ATR14 $0.45 (5.17% of the close). These describe the chart, not an entry, stop order or price objective. No company event on September 28–October 2 is assumed unless explicitly listed.
BB · 60 regular sessions · USD
Blue: SMA20. Purple: SMA50 (starts only when 50 observations are available). Candles: green close ≥ open; red close < open. Lower bars: IBKR reported volume, scaled to the chart maximum. No future prices or projected returns. On small screens, scroll the chart horizontally.
Source: IBKR daily RTH TRADES; Merlintrader calculations. Prices through September 24, 2026.
$EFOR · Everforth
Conditional event case: A new federal contract extension with an orderly chart, but no confirmed improvement in bookings
September 24 close $32.43 · SMA20 $32.08 · SMA50 $29.47 · volume/prior20 0.80× (IBKR series)
Business evidence and why now. On September 24, Everforth ECS announced a three-year sole-source SUNet IDIQ extension with a $148 million ceiling and a separate selection to research and prototype SUNet 2.0. IDIQ means indefinite delivery/indefinite quantity: the ceiling is not a guaranteed order, revenue or cash receipt. This specific award is supported by one issuer announcement; it has not been independently validated against a government award record in this edition. It is still a real, dated company development rather than an assumed benefit from general defence spending.
What the price confirms—and what it does not. The September 24 close of $32.43 was above SMA20 $32.08 and SMA50 $29.47; SMA50 had risen 11.40% over ten sessions. The price was only 1.08% above the short average. That is a less extended chart than BB or AVT. However, the stock lost 1.01% from September 18 and volume was only 0.80× its IBKR prior-20-session norm. It therefore fails the positive-week filter used for the three technical candidates and remains explicitly conditional. The contract announcement has not yet generated a confirmed new price impulse.
What would strengthen the case. Continued acceptance above $32.08, followed by a stronger close through the observed $34.42 high with expanding participation, would link the new contract story to actual market demand. A quiet stock after an announcement is not automatically an undiscovered opportunity. Funded orders, task-order timing and improvement in federal book-to-bill would provide stronger business confirmation than repeating the ceiling value.
What would weaken or invalidate the case. A sustained loss of SMA20 would weaken the near-term structure; the observed $30.24 low is the more demanding warning, with SMA50 below it. July 29 Q2 revenue was $1.007 billion versus $1.021 billion a year earlier, and adjusted EBITDA declined to $96.7 million from $108.5 million. Federal book-to-bill for the trailing twelve months ended June 30 was 0.8, so the new award does not yet prove a broad order recovery. The business also carries substantial debt. Its July refinancing was described as leverage-neutral, not deleveraging. Federal budget timing, contract execution, task-order funding and weaker commercial demand can offset the attractive headline.
Observed reference range: prior-20-session high $34.42; latest 10-session low $30.24. ATR14 $1.72 (5.31% of the close). These describe the chart, not an entry, stop order or price objective. No company event on September 28–October 2 is assumed unless explicitly listed.
EFOR · 60 regular sessions · USD
Blue: SMA20. Purple: SMA50 (starts only when 50 observations are available). Candles: green close ≥ open; red close < open. Lower bars: IBKR reported volume, scaled to the chart maximum. No future prices or projected returns. On small screens, scroll the chart horizontally.
Source: IBKR daily RTH TRADES; Merlintrader calculations. Prices through September 24, 2026.
The week ahead: actual events, not automatic bullish catalysts
All times are U.S. Eastern Daylight Time. Rome is six hours ahead during this week. Announced dates remain subject to change. September 30 is also quarter-end; any claim about compulsory buying or “window dressing” would require positioning evidence that is not available here.
AIR is still below both averages. CNXC is close to SMA20 with a rising SMA50. Earnings gaps can override either structure; the date alone is not a positive signal.
Wed Sep 30 · 08:30 ET
Q2 GDP third estimate and August Personal Income and Outlays, including PCE. BEA schedule.
Inflation and demand matter across all five cases, particularly valuation-sensitive technology shares. These releases occur together.
The September 22 closing of the $400 million Domo AI/data acquisition makes funding, integration and updated outlook concrete questions. PRGS remains below both averages. Acquisition closing.
Payrolls, unemployment and wages can alter both rate and growth expectations. This is the final major macro test of the selected week.
AIR, PRGS and CNXC appear because their results are scheduled; they are not added to the main technical selection. A favourable surprise is possible, but a reporting date alone does not establish the direction or size of the gap.
Previous edition: the technical selection underperformed
All five previous technical setups were down from September 18 to September 24. Their simple equal-weight average price change was −5.90%, versus −0.86% for IWM, a shortfall of 5.04 percentage points. This is a partial-week research audit, not the return of an implemented portfolio. It excludes September 25, dividends, costs and any actual trade execution.
The prior table’s “Week” column described September 11–18, before the September 19 publication. It was historical context, not the subsequent outcome. The audit below explicitly separates those dates. It preserves every prior name instead of retaining only the winners.
Ticker
Prior editorial group
Sep 18 close
Sep 24 close
Price change
KBH
Calendar / forward preview
47.12
47.65
+1.12%
THO
Calendar / forward preview
67.77
70.93
+4.66%
MLKN
Calendar / forward preview
20.66
19.91
-3.63%
WOR
Calendar / forward preview
57.38
60.33
+5.14%
WS
Calendar / forward preview
33.33
35.48
+6.45%
CRL
Calendar / forward preview
278.06
294.44
+5.89%
AIR
Calendar / forward preview
112.77
120.56
+6.91%
FSM
Technical selection
11.95
11.50
-3.77%
EXK
Technical selection
10.21
9.16
-10.28%
HBM
Technical selection
26.90
26.48
-1.56%
STNG
Technical selection
87.16
80.96
-7.11%
TNK
Technical selection
100.92
94.08
-6.78%
AVAV
Additional comparisons
159.95
158.55
-0.88%
HYLN
Additional comparisons
4.20
4.20
+0.00%
AEHR
Additional comparisons
93.49
97.42
+4.20%
BKSY
Additional comparisons
21.67
23.17
+6.92%
PL
Additional comparisons
16.42
17.62
+7.31%
Across all 17 previous cases, nine rose, seven fell and one was unchanged. That mixed result does not rescue the specifically positive technical selection: its five names all declined. Three miners and two tanker companies concentrated the selection in two linked risk clusters. Three miners also lacked a completed short-term recovery; the tankers were already extended. This edition gives technical confirmation and concentration a stricter role.
The failed cases remain relevant to the method. A close below an observed reference can signal that the original structure has weakened, but it is not proof an investor could have exited at that price. Gaps, spreads and overnight news make such an assumption unreliable.
Why other plausible candidates did not make the main list
Candidate
What attracted attention
Reason for exclusion or lower priority
EXK
Silver exposure and last week’s rebound thesis.
September 22 issuer notice: Guanacevi’s primary mill stopped September 21; repairs expected to take about three weeks, with throughput about 600 versus 1,100 tonnes/day. Close $9.16 is below both averages. Operational update.
FSM / STNG / TNK
Precious metals, freight rates and previously rising intermediate trends.
All are below SMA20 at the cutoff. They need a new recovery signal; a conference or favourable sector narrative does not repair the failed short-term selection. No automatic rollover.
FSLY
Investor Day and +11.82% since September 18.
The September 24 session lost 10.02%, on 2.61× IBKR relative volume. ATR14 is about 10% of price. The positive multi-day number masks a sharp reversal; this is not a clean momentum lead.
WTTR
September 24 agreement to acquire Pilot Water for $700 million, before contingent consideration.
Consideration includes $600 million cash and $100 million stock, adding financing and dilution risk. At September 24 close $19.53, the stock was below both averages; the September 25 call and premarket response are outside the chart cutoff. Closing is expected in Q4, not guaranteed next week. Acquisition filing.
NNBR
Raised guidance and recent price recovery.
Below the $300 million and $5 screening thresholds at the discovery snapshot. September 30 shareholders vote on doubling authorized common shares from 90 million to 180 million. Authorization is not automatic issuance, but financing complexity makes it unsuitable for the main list. Proxy.
POWL / AMSC / PLAB
Electrical infrastructure or semiconductor-cycle exposure.
All were still below SMA50 at the completed-session cutoff. POWL and AMSC also had falling intermediate averages. Interesting businesses remain watch items until their charts repair.
QLYS
Cash-rich cybersecurity business, raised guidance and a rising SMA50.
A credible reserve, but September 24 closed near the session low after reaching $190, with only 0.48× IBKR volume. It needs stabilization rather than an assumed breakout. Its financial quality is stronger than AVT’s leverage profile; technical evidence does not erase that trade-off. August 4 results.
EFXT
Gas-infrastructure orders, lower leverage and positive one-month relative strength.
Near the $23.28 prior high, but the September 24 close did not hold the intraday breakout, SMA50 was still drifting down and U.S.-line liquidity was thinner than most developed cases. A reserve, not a forced fifth technical name. Q2 results.
GAP
Improving technical position and an increased adjusted EPS outlook.
Q2 sales fell 2% and comparable sales 1%. Reported gross margin included an 11.4-percentage-point net benefit from expected tariff recoveries; that is not recurring operating improvement. Q2 results.
HBM / CRDO / LITE
Copper or AI-infrastructure interest.
Above the declared $10 billion research ceiling at the screening snapshot. A familiar ticker does not qualify as a mid cap merely because it appeared in earlier coverage.
Geopolitical tension is not a universal positive catalyst. Refining margins, tanker freight and producer cash flow depend on different variables, while a demand shock or normalization of shipping routes can hurt several exposures together. The new list is therefore not another concentrated bet on a single commodity or shipping narrative.
How the numbers and charts were calculated
All displayed closes, chart candles and technical calculations use IBKR daily regular-session TRADES observations through September 24, 2026. The retained extracts contain 83 sessions per instrument. SMA20 and SMA50 are arithmetic means of the most recent 20 and 50 closes; the intermediate slope compares SMA50 with its value ten sessions earlier. The chart shows 60 sessions, with a moving-average curve only where sufficient prior observations exist.
Price change = (ending close / starting close − 1) × 100. The audit and short comparison use September 18–24; the longer comparison uses August 24–September 24. Relative strength in the summary is the stock’s return minus IWM’s return, in percentage points. These are price returns, not reinvested-dividend returns. A positive relative result can coexist with an absolute loss.
Volume ratio = September 24 volume divided by the average of the preceding 20 sessions, excluding September 24. It is calculated entirely within the IBKR series. Finviz historical checks agree with IBKR on all 126 closing prices checked across six names and 21 matched dates, but reported volumes differ. SPNT’s relative-volume magnitude differs materially; the above-normal direction agrees. No claim of consolidated exchange volume is made. Provider quantities are not mixed in one ratio.
The prior20 high excludes the latest session; the 10-session low includes it. ATR14 uses Wilder smoothing of true ranges from the four-month extract and is an estimate of recent price variability, not a loss limit. Small high/low differences between data vendors may alter an exact pivot by a few cents. Charts and levels contain no projected prices.
Capitalization classification uses a $300 million–$10 billion research band, with market screening checked against the latest dated common-share count where disclosed. The market values below are Merlintrader calculations using September 24 prices and those earlier share counts, not real-time fully diluted valuations. Repurchases, stock compensation, convertibles and later issuance can change the share base.
The aim is to improve selection quality, not to promise profitable outcomes. Three technical candidates and two conditional event cases replace an undifferentiated long list. A headline, conference appearance, analyst mention or rebound after a large loss is not sufficient on its own.
First: security, size and liquidity
U.S.-listed common equities, non-biotech remit and an indicative $300 million–$10 billion market value. The initial Finviz discovery filters used price above $5, average daily volume above 500,000 shares, positive weekly performance and price above SMA20 and SMA50. That live snapshot can include premarket prices, so every developed setup was recalculated at the same completed-session cutoff. Names added through primary-source news still need the same security and risk checks.
Second: evidence that belongs to this company
Operating results, cash conversion, contract economics, financing and the precise timing of news. An IDIQ ceiling is not guaranteed revenue; a buyback authorization is not a completed purchase; a product launch is not an order. If a conference or reporting date is the only new fact, the name remains in the calendar rather than becoming a bullish selection.
Third: demand for the shares
Relative strength, position above the averages, direction of the intermediate trend, volume and the latest candle are assessed together. A positive weekly percentage can hide heavy selling in the most recent session. A breakout needs a close and subsequent acceptance, not just an intraday touch. An already stretched move receives a lower priority even if the business story is attractive.
Fourth: an observable failure condition
Every case carries both a price-based warning and a business risk. The cases can remain unconfirmed or fail entirely. An absent setup is preferable to filling a quota. This is an editorial watchlist, with no allocations, entry instructions, price targets or measured success probabilities.
No assumption of undiscovered value is made. The good news may already be reflected in the price. There is no complete options-implied move, analyst-consensus model or positioning study in this edition, so it does not claim a quantified valuation advantage, a short squeeze or a probability of outperformance.
What each company report examines
Catalysts and contracts
Government awards, commercial wins, product launches, regulatory decisions and strategic milestones that can change what the market expects, each with the document that establishes it.
Earnings and execution
Revenue quality, margins, backlog conversion, guidance and the distance between what management said it would deliver and what it delivered.
Capital structure
Cash, runway, debt, share issuance, warrants, convertibles and the at-the-market programmes that quietly reshape per-share value.
Risk and volatility
Liquidity, valuation, concentration, ownership, insider activity and the specific events that would invalidate the prevailing narrative.
Sources and boundaries
Company investor-relations releases and SEC filings linked next to the relevant facts. Company announcements are management disclosures; a release and its SEC exhibit are corroborating formats, not independent opinions.
IBKR for dated daily prices and technical calculations; Finviz Elite for screening, discovery and the explicitly described cross-check. Intraday figures are excluded from completed-session results.
Federal Reserve, BLS, BEA and ISM for policy and the announced macro calendar. An official scheduled release is not a forecast of its result.
IBKR news headlines were checked for recent developments in the developed and event cases. News services and social chatter are discovery aids; unverified price targets and rumours are not reproduced.
Company facts retain their original reporting periods and announcement dates. Market data were retrieved September 25, with September 24 as the latest completed-session cutoff. Material information released later on September 25 or over the weekend may change the analysis. No automatic follow-up or ongoing monitoring is implied.
Educational research only. This page is published for educational and informational purposes. It is not investment advice, not a recommendation, and not an offer or solicitation to buy or sell any security. Merlintrader is not a registered investment adviser or broker-dealer. Small and mid-cap securities can be highly volatile and may have limited liquidity. Company filings, market data and scheduled dates can be revised by the issuer or the agency that published them, and past performance does not indicate future results. Always do your own research and consult a licensed financial adviser before making any investment decision. Full disclaimer: merlintrader.com/disclaimer.
Gravity ($GRVY) deep dive: verified Q1 2026 and FY2025 numbers, ~$400M cash and no debt against a ~$440M market cap, the Ragnarok launch engine, GungHo control, and the bull vs bear case. Educational, not advice.
A full single-stock deep dive on Hyliion’s transition from electric powertrains to modular fuel-agnostic power generation, with a focus on Q1 2026 results, KARNO commercialization, U.S. Navy activity, data center demand, liquidity, risks, catalysts and trading setup.
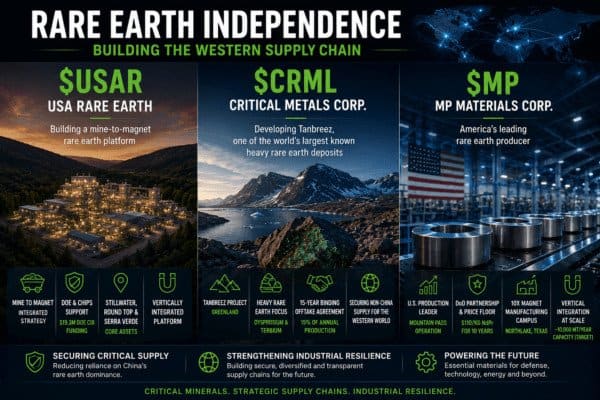
ENIT Rare Earth Reset · May 2026 · $USAR $CRML $MP Rare Earth Independence Is Back: $USAR, $CRML and $MP Race to Rebuild the Western Supply Chain USA Rare Earth, Critical Metals and MP Materials sit at three different points of the same strategic puzzle: mine-to-magnet integration, Greenland heavy rare earth feedstock, and America’s most… Read more: Rare Earth Independence Is Back: $USAR, $CRML and $MP Race to Rebuild the Western Supply Chain
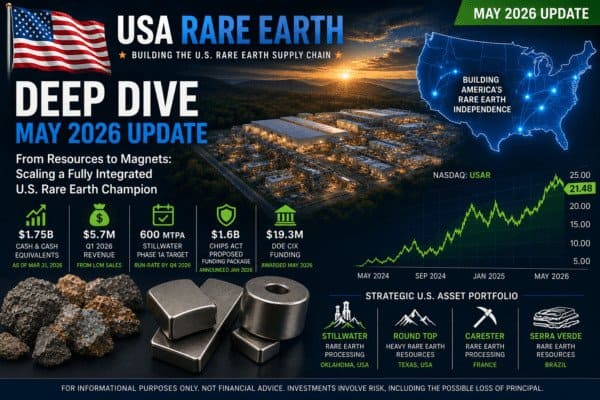
DOE selection, Q1 numbers, Stillwater magnet ramp, Round Top consolidation, Serra Verde, Carester and the real question for investors: can USA Rare Earth turn a heavily funded national-security story into a commercially disciplined mine-to-magnet platform?
With oil back in focus after U.S.–Israeli strikes on Iran and renewed risk around the Strait of Hormuz, U.S. Energy Corp. (USEG) offers a very different angle from the majors: a small, vertically integrated platform trying to combine legacy oil and gas production with a large industrial gas and carbon management project at Kevin Dome in Montana. This is a deep dive into what USEG really is, how Kevin Dome fits into the 2026 energy landscape, and which catalysts matter from here.
Focus on factual developments of the last few days (Strait of Hormuz, tankers at anchor, oil spike) and on a sector-based watchlist – not on trying to predict the endgame of the conf
Supersonic test platform based at NASA Kennedy Space Center, no meaningful revenue yet, big ambitions on STARLAUNCH and a valuation already pricing in a lot of execution.
Next business catalyst
Late February 2026 – expected Q4 2025 earnings and business update, with more detail on 45X tax credit monetization, Giga America ramp and FEOC-compliant sourcing.
Rigetti is one of the few pure-play public quantum computing hardware names. It designs and manufactures superconducting quantum processors, integrates the control stack and cryogenics around them, and exposes these systems through a cloud platform so that enterprises, governments and researchers can experiment with quantum algorithms and hybrid quantum-classical workflows.
In early January we started to follow Ondas Inc. (ONDS) more closely on Merlintrader, first with a long-form deep-dive on the transformation of the group into an autonomous defense “system-of-systems” platform, and then with a sequence of updates as new contracts and Investor Day details emerged. Those articles focused on the structural story, the DCMA “Blue UAS” listing for Optimus and the growing defense pipeline.
In mid-January we covered BNAI as a tiny, risky AI play with a handful of real enterprise projects and a fragile balance sheet. Two weeks later the stock has printed a 52-week range from $1.18 to an intraday high above $80, short interest has exploded, and the company rushed out multiple press releases on licensing, warrant exercises, debt conversion and a premium private placement. This note is meant to put everything back into one framework: what BEN actually does, what changed in January, how stretched the valuation looks, and which hard catalysts matter once the trading dust settles.
SKYX wants to turn the ceiling into the “brain” of the home: a plug & play outlet that makes lights, fans and smart devices safer and easier to install, plus an AI-native platform built on NVIDIA’s cloud ecosystem. Revenues have climbed to record levels through Q3 2025 and the company has just secured new strategic and institutional funding ahead of big launches at Lowe’s and early smart city deployments.
When you line up the numbers on artificial intelligence in space operations, autonomous systems and new-generation missile defence, it becomes very clear we are not looking at a “nice theme” to trade for a few quarters. We are watching the birth of a structural, AI-native arms race that stretches easily over the next 20–30 years.
AI platform targeting highly regulated clients. Q4 2025 marked a “turning point”: a top-10 pharma engagement project, the Skye Salud sovereign healthcare JV in Mexico, and a first step in cleaning up a heavily diluted balance sheet.
Jeffs’ Brands Ltd is a tiny Israeli micro-cap originally built around a data-driven Amazon FBA portfolio. That legacy business is still there: roughly $13.7M revenue in FY2024 against a net loss of about $7.8M, with a very small equity value and high operating leverage. The last twelve months have been brutal for long-term holders, with a price trajectory closer to a ski slope than a growth story.
AI platform for regulated clients. Q4 2025 pivot built on a top-10 pharma engagement project, the Skye Salud sovereign healthcare JV in Mexico and a first step of balance-sheet clean-up with Nasdaq compliance restored.
Briefing Space-AI-Defence stocks Jan 14
Daily overview on defence, space and AI-linked military names: Grok enters Pentagon networks, MBDA strengthens its position in Brazil and space small caps swing between rational euphoria and technical risk.
Datavault AI Inc. (Nasdaq: DVLT) is a small/micro-cap technology company that wants to sit at the intersection of AI, Web3 and data monetization. It licenses a portfolio of patents and software platforms to tokenize and value “real-world assets” (RWA) – from genomic data and prescription flows to commodities and luxury goods – and still carries the legacy wireless-audio business acquired from WiSA.
SIDU, ASTS, LUNR, ONDS and PL are not just “hot tickers”. Their satellites, landers, drones and imaging constellations are becoming building blocks of a Western answer to China’s dual-use space programs, Russia’s drone war and a world where infrastructure and data are contested every single day.
Government money and Formula 1 DNA behind the Cavorite X7
In October 2025 Horizon announced an INSAT (Initiative for Sustainable Aviation Technology) grant to fund “Project CRYSTAL”, a 10.5 M CAD all-weather eVTOL programme focused on icing detection and protection. Horizon will receive about 2.0 M CAD in non-dilutive proceeds, working with the Flight Test Centre of Excellence (3C) and the University of Toronto on a propulsion system that can operate in conditions where most helicopters are grounded.
Huge 2025 comeback – after trading below 1 USD, OPEN staged a massive rebound, with the share price up roughly 400–450% in 2025 on the back of retail enthusiasm, leadership changes and a “short squeeze” narrative.
Real business, real losses – this is not a pre-revenue story. Opendoor generated 3.635B USD of revenue in the first nine months of 2025, but still reported a net loss of 204M USD over the same period.
Heavy balance sheet usage – the company ended Q3 2025 with 962M USD of cash and 1.79B USD of debt, for a net cash position of about −830M USD. This is not an asset-light software-only model.
TMC is not a traditional small biotech or junior miner. It is a high-beta small/mid cap trying to open an entirely new segment: harvesting polymetallic nodules on the ocean floor in the Clarion-Clipperton Zone, with the idea of feeding the electric-vehicle and strategic metals supply chain.In 2025 the stock moved from just above 1 USD to a peak above 11 USD, closing the year still several hundred percent above the starting point. That kind of move puts TMC firmly on any “small caps of the moment” radar: strong narrative, strong retail interest, highly directional.
 Umbria