01 Viatris stock: what shareholders actually own
Viatris enters the final quarter of 2026 with two pending U.S. regulatory decisions and a newly announced acquisition that could change its presence in pain medicine. That makes VTRS a useful catalyst stock to study, but its economics differ substantially from those of a development-stage biotechnology company. Existing medicines already generate billions of dollars of quarterly revenue. A single approval can improve the growth outlook without determining whether the entire business survives. Conversely, that established revenue base does not eliminate debt, manufacturing or capital-allocation risk. [1] [2] [3] [4]
The central investment question is whether cash generated by established products can support a durable transition toward differentiated medicines while preserving financial flexibility. New products need to offset pressure elsewhere, and acquisitions need to earn adequate returns after financing and integration costs. Revenue growth achieved by purchasing another company is economically different from growth achieved by selling more of an existing product. Both can create value, but they require separate measurements. Pacira therefore deserves analysis as a capital commitment, not simply another name added to a pipeline slide.
There are three distinct horizons. The October 17 phentolamine date tests a proposed presbyopia indication. The December 27 meloxicam date tests a proposed acute-pain product. The Pacira agreement introduces an expected year-end closing process and a longer integration period. Beyond these events, cenerimod and selatogrel require their own development evidence. Combining all of them into one undifferentiated “FDA story” would hide the differences in timing, ownership, clinical risk and financial contribution. [1] [3] [4] [8]
Our constructive interpretation is that Viatris has a commercial foundation capable of supporting new launches and a broader portfolio than its reputation as an established-products company might suggest. Our counterargument is that investors must pay for the transition through development costs, acquisition consideration and operational complexity before the full benefits are visible. A low adjusted earnings multiple can coexist with an expensive transition if recurring cash costs are consistently excluded from the headline measure.
The analysis that follows keeps those questions separate. Financial statements describe what happened through June 30; management guidance describes expectations issued on August 6; the Pacira announcement adds information from October 8; market data refer to the October 8 regular-session close. None is a substitute for the others. In particular, the August outlook should not be silently presented as a complete forecast for a combined Viatris–Pacira business that had not yet been announced. [1] [2]
02 Business model, products and geographic exposure
Viatris Inc. trades on Nasdaq under VTRS. Its corporate materials identify a U.S. headquarters and global centers in Pittsburgh, Shanghai and Hyderabad. The business spans branded medicines, generics and newer differentiated products across multiple markets. This distribution matters to shareholders because regulatory approvals, reimbursement systems, currency movements and competitive conditions differ by territory. A familiar brand name does not mean identical commercial rights or pricing in every country. The relevant question is the revenue and profit attributable to Viatris in its actual markets. [2] [8]
Second-quarter 2026 net sales illustrate the mix. Branded products contributed $2,418.4 million and generics $1,327.5 million, totaling $3,745.9 million before other revenue. The business therefore cannot be understood solely by counting innovative pipeline assets. Established products still fund much of the operating system that supports research, manufacturing, distribution and shareholder returns. Their durability is a central part of the investment case rather than background detail. [2]
The largest reported regional grouping was Developed Markets, with $2,193.7 million of quarterly net sales. Greater China contributed $713.8 million, Emerging Markets $542.3 million, and JANZ $296.1 million. The differences in growth were significant: Greater China rose 21% as reported and 16% operationally, while Emerging Markets fell 2% on both bases. Developed Markets increased 4% as reported and 2% operationally; JANZ declined 3% as reported but was flat operationally. These measures show why currency and the underlying business trend should be separated. [2]
Product concentration also needs a more detailed view than “many drugs means no risk.” Lipitor contributed $452.2 million of quarterly sales and Norvasc $200.2 million. EpiPen, Lyrica, Viagra and Creon were also meaningful contributors in the disclosed product table. An established portfolio can diversify clinical risk while remaining exposed to pricing pressure, supply interruptions and changes in prescribing. The appropriate monitoring exercise is to identify which products and regions explain growth, rather than extrapolate the strongest region across the whole group. [2]
The commercial platform is potentially valuable to development partners because distribution and launch capabilities take time to build. However, a broad platform also carries fixed costs and managerial demands. A successful transformation would show that new products use that infrastructure efficiently. A weaker outcome would show rising launch and integration spending without enough incremental profit. That distinction should become visible through segment trends, margins and cash generation, not through the number of partnership announcements alone.
03 Pacira acquisition: terms, strategic logic and execution risk
On October 8, Viatris announced a definitive agreement to acquire Pacira BioSciences for $36.50 in cash per share, representing approximately $1.65 billion of aggregate equity value. This is an announced transaction, not a completed acquisition. The disclosed equity consideration is also not an enterprise-value calculation: target debt, cash and other balance-sheet adjustments would have to be reconciled separately before applying that label. Viatris expects closing by the end of 2026, subject to the transaction conditions. [1] [5]
The transaction structure uses a tender offer followed by a second-step merger. Sufficient shares must be tendered, applicable regulatory requirements must be satisfied and the other customary conditions must be met. A target date for closing expresses management’s expectation; it does not remove the possibility of delay. Until closing, readers should avoid treating Pacira’s products, employees and reported financial results as if they were already consolidated into Viatris’s historical accounts. [1] [5]
Pacira brings EXPAREL, a liposomal bupivacaine injection, and ZILRETTA, an extended-release triamcinolone injection used in the knee osteoarthritis setting. The strategic connection is a broader non-opioid pain franchise that could also support Viatris’s investigational oral meloxicam if approved. These are different products, routes of administration and clinical settings. Their potential commercial relationship does not establish interchangeability, a common label or an automatically successful bundled offering. [1]
The announcement cites approximately $746 million of Pacira revenue and $177 million of adjusted EBITDA for the twelve months ended June 30, 2026. Dividing the announced equity value by those figures produces approximately 2.2 times revenue and 9.3 times adjusted EBITDA. These are only equity-consideration comparison ratios. They are not enterprise-value multiples, and the EBITDA figure is adjusted rather than GAAP income. The simple arithmetic is useful for scale, but insufficient for deciding whether the price is attractive. [1]
Viatris expects to fund the acquisition primarily from excess cash, with the balance from short-term borrowings. Management also expects immediate accretion to its financial guidance metrics and minimal impact on its gross leverage ratio. Those are prospective company statements. “Accretive” does not by itself establish GAAP earnings accretion, a satisfactory return on invested capital or an improvement in every cash-flow measure. The release does not provide a quantified synergy target that this hub can independently underwrite. [1]
The first checkpoints are closing conditions, final funding and the accounting and guidance supplied after completion. Later checkpoints include product growth, integration costs and the incremental cash left after financing. Pacira’s research programs may add optionality, but development assets should not be valued as approved products. A disciplined assessment asks whether the acquired operating cash flows and credible future opportunities justify the cash committed, while allowing for competition and execution risk.
04 October 17 PDUFA: phentolamine for presbyopia
The nearest scheduled FDA target is October 17, 2026, for Viatris’s supplemental application for MR-141, phentolamine ophthalmic solution 0.75%, in presbyopia. The FDA accepted the application in February. Presbyopia involves an age-related reduction in the ability to focus on nearby objects. The proposed product seeks to improve near vision through an ophthalmic approach; it is not a gene therapy and does not reverse the underlying aging process of the eye. [3]
Phentolamine already has a U.S. approval under the Ryzumvi name for reversal of pharmacologically induced mydriasis. That prior approval concerns a different indication. It provides relevant product history, but it is not an approval for presbyopia. The pending supplemental review addresses whether the evidence, labeling and other requirements support the expanded use. Approval dates, launch dates and the timing of meaningful commercial sales should therefore remain separate in any investment model. [3]
The sponsor states that the Phase 3 VEGA-2 and VEGA-3 studies achieved their primary and key secondary endpoints. It also reported no treatment-related serious adverse events in those trials. This supports the rationale for the submission, while leaving the FDA to evaluate the full evidence. A favorable trial headline does not establish the final wording of the label, the breadth of eligible patients, the instructions for use or the commercial positioning that would follow a decision. [3]
The commercial hurdle is broader than statistical significance. Patients have alternatives for near-vision correction, and any prescription approach must establish a useful balance of effect, convenience, tolerability and cost. A large population with presbyopia is not the same as a large immediately addressable prescription market. Adoption depends on how many suitable patients seek treatment, receive a prescription, fill it and continue using the product under the approved instructions. These are analytical considerations, not undisclosed company forecasts.
Opus Genetics has milestone and royalty interests under its agreement with Viatris. Consequently, Viatris’s product sales and the economics retained by Opus are different quantities. A potential sales figure cannot be assigned in full to both companies. For VTRS, launch expenditure and partner obligations belong in the analysis alongside gross revenue. For Opus, royalties and milestones are a different measure from total end-market sales. Our separate Opus hub examines that financing and partnership structure in detail. [14]
The event can affect VTRS’s price if the decision materially changes expected future cash flows or confidence in execution. However, the same event represents a smaller share of a diversified company’s economics than it might for a smaller partner. That is why the decision is neither irrelevant nor automatically transformational. Its importance depends on the outcome, the label, the expectations already reflected in the shares and the subsequent commercial evidence.
05 December 27 PDUFA: fast-acting oral meloxicam
Viatris’s second scheduled U.S. decision is December 27, 2026, for MR-107A-02, a fast-acting oral meloxicam formulation for moderate-to-severe acute pain. The FDA accepted the new drug application in May. The submission uses the 505(b)(2) pathway, which can incorporate certain existing information while requiring the evidence needed for the proposed product and use. It remains an investigational formulation under review. It is distinct from a meloxicam–rizatriptan migraine combination. [4]
The development proposition is faster absorption of an established nonsteroidal anti-inflammatory drug, with the aim of providing timely analgesia in an acute setting. Faster drug exposure can support a pharmacological hypothesis, but exposure alone is not a clinical outcome. The application therefore also relies on studies that measured pain relief and related endpoints in patients. The commercial proposition requires more than a pharmacokinetic difference: prescribers and payers need a clinically useful reason to select a differentiated formulation. [4] [7]
The sponsor describes two Phase 3 studies, one following herniorrhaphy with 579 participants and one following bunionectomy with 410 participants. Both were randomized and double-blind, with placebo and an active tramadol arm. The primary efficacy comparison was against placebo over the first 48 hours. The active comparator supported assay sensitivity. Its presence does not mean that the program established confirmatory superiority over every commonly used pain treatment. [4]
For shareholders, a favorable FDA decision would remove one important uncertainty, but would introduce a different set of questions. The approved indication, warnings, dosing and any limitations would shape the opportunity. Access, formulary placement, net pricing and physician familiarity would then influence the launch. None of these can be settled by a PDUFA date alone. A complete model would also allow for the time and spending required to build use in the relevant clinical settings.
The proposed Pacira acquisition creates an additional strategic dimension. Viatris could gain a stronger presence in non-opioid pain while pursuing an oral product through its own review. Yet a potential platform benefit is not a quantified revenue synergy. Different sites of care and routes of administration can require distinct commercial approaches. The acquisition and the NDA also retain separate risks: the transaction could close without drug approval, or the drug could receive a decision while integration remains incomplete. [1] [4]
The most useful year-end dashboard therefore has separate rows for the regulatory outcome, transaction closing, launch plans and financial guidance. Combining them into a single “pain franchise success” assumption would make it difficult to identify which part of the thesis actually improved. It would also make a disappointment in one area look like evidence against unrelated assets, which is not a sound way to read a diversified pharmaceutical company.
06 What the published meloxicam studies demonstrate
We used Consensus to locate scientific evidence and retrieved the paper records before citing them. A 2026 Phase 3 bunionectomy publication by Bertoch and colleagues in Pain and Therapy provides a useful layer beyond the sponsor’s headline. Its abstract reports 410 randomized participants and 397 who completed the study. The primary comparison showed a higher summed pain-intensity difference through 48 hours for MR-107A-02 than placebo: 183.9 versus 101.2, a difference of 82.7, with p below 0.001. These are trial endpoint values, not percentages of patients cured. [6]
The same report describes less rescue opioid use and a larger opioid-free proportion in the treatment arm. The opioid-free figures were 56.9% versus 33.1%, an absolute difference of 23.8 percentage points. Keeping absolute and relative changes separate is important: a relative reduction in opioid use is not the same statistic as the difference in the proportion of patients who avoided opioids. Neither means all treated patients required no additional analgesia. The results apply to the studied postoperative setting. [6]
An exploratory comparison involving tramadol was post hoc and not powered as a confirmatory superiority test. It can generate hypotheses and provide context, but it does not prove superiority to tramadol. This is a material distinction for investors because strong comparative claims can imply a larger commercial advantage than the study design supports. A placebo-controlled efficacy result and an adequately designed head-to-head superiority result answer different questions.
A separate 2025 pharmacokinetic publication by Hummel and colleagues compared MR-107A-02 with a conventional meloxicam product in healthy male participants under fasting conditions. Eighteen were randomized and sixteen completed the study. The reported median time to maximum concentration was 0.75 hours versus four hours. That supports a faster-absorption profile in the observed conditions. A small healthy-volunteer study does not establish comparative pain relief across surgical populations or long-term safety in routine practice. [7]
The evidence forms a chain rather than interchangeable pieces of proof. Formulation research supports a mechanism for faster exposure. Patient studies test whether a useful clinical effect is observed. Regulatory review considers the total package for a proposed label. Commercial performance then tests whether the product offers sufficient practical value at the price and access conditions available. A positive result at one stage strengthens the case for the next, but does not complete it.
“Non-opioid” also does not mean risk-free. Meloxicam remains an NSAID, and any eventual label and prescribing information would control its approved use. This hub evaluates the development and commercial evidence; it does not recommend a pain treatment. For valuation, the relevant discipline is to avoid translating an encouraging endpoint into an unrestricted market claim, especially before the final regulatory outcome and launch details are available.
07 The wider pipeline beyond the two FDA dates
Viatris’s public pipeline is explicitly dated August 6, 2026. That date matters: the table is a reference point, not proof that every entry has been updated for subsequent events. For example, the later September announcement of a Japanese WAKIX approval supersedes an earlier “awaiting decision” status. We use the latest asset-specific primary disclosure where available, rather than blindly copy a single pipeline table into a current hub. [8] [9]
Cenerimod, a selective S1P1 receptor modulator, is being developed in systemic lupus erythematosus. The August pipeline states that enrollment in OPUS-1 and OPUS-2 is complete and that readouts for both Phase 3 studies are targeted for the first half of 2027. These are prospective data windows. Enrollment completion does not establish efficacy, and a readout target is not a regulatory decision date. A lupus nephritis program has a separate, later development timeline. [8]
Selatogrel is an investigational P2Y12 inhibitor being studied for acute myocardial infarction. The same pipeline lists Phase 3 enrollment as ongoing and targets completion during 2026. A patient-activated treatment concept creates questions beyond pharmacology, including identifying the appropriate population and demonstrating outcomes in the intended setting. An enrollment milestone is not a prediction of approval, and positive early evidence does not resolve the pivotal study. [8]
Other assets demonstrate the importance of territory and development stage. Nefecon, or VR-205, has a positive Phase 3 study in Japanese patients with IgA nephropathy and an August-stated target for a Japanese submission in the second half of 2026. Inpefa’s listed Viatris opportunity excludes the United States and Europe. The company’s current materials also distinguish an approved combined contraceptive patch from a separate progestin-only development program. Similar names or therapeutic categories do not mean identical rights or status. [8]
The pipeline picture also includes setbacks. The August table states that the primary objective was not met in the Phase 3 Influvac High Dose study and that next steps are being evaluated. Omitting such entries while counting every positive program would overstate the quality of the portfolio. The development process includes failures, delays and programs whose commercial promise remains uncertain even when an intermediate milestone is achieved. [8]
The portfolio can diversify individual clinical risks, but the programs still compete for capital and managerial attention. The useful question is which milestones can materially change expected cash flows within a realistic period. Asset counts, disease prevalence and management descriptions of potential markets are starting points for research, not a sum-of-the-parts valuation. Each asset needs its own probability, timing, territory, partner obligations, cost and competitive assumptions before being assigned a financial contribution.
08 Approved products, Japan and launch execution
The August 6 update also identifies an Accord Healthcare agreement for filgrastim, ustekinumab and teriparatide in France, and Idorsia co-promotion of Quvivq in Italy and Canada. In June, FDA approved generic ferric carboxymaltose injection in 750 mg/15 mL, 1,000 mg/20 mL and 100 mg/2 mL strengths. Viatris second-quarter 2026 results release.
On September 16, Viatris announced Japanese approval of WAKIX, or pitolisant, for narcolepsy and excessive daytime sleepiness associated with obstructive sleep apnea syndrome. The stated sleep-apnea use concerns patients receiving treatment for airway obstruction. This is a country-specific regulatory development. Viatris’s agreement with Bioprojet grants exclusive rights to commercialize pitolisant in Japan; it does not establish that Viatris owns the U.S. or worldwide WAKIX franchise. [9]
The distinction matters when comparing opportunity estimates across companies. Global sales of a branded drug cannot simply be assigned to a licensee in one country. A Japanese launch depends on local pricing, reimbursement, physician adoption and the licensed economics. Approval reduces regulatory uncertainty for the specified use in Japan, but it does not provide a verified revenue ramp. The initial commercial evidence will need to be assessed against the costs and expectations attached to the opportunity.
The July approval of Gwyn Lo, a once-weekly combined hormonal contraceptive patch, is another example of an approved product with launch work still to do. In its August financial update, Viatris expected commercialization later in 2026. That timing is a management expectation as of the release, not a confirmed launch date supplied by this hub. A separate pipeline entry for a progestin-only patch is not a second approval of the same product. [2] [8]
New-product revenue was approximately $101 million in the second quarter and $172 million in the first half. The full-year company outlook was $450 million to $550 million. This creates a practical test for the second half: how much incremental revenue actually emerges, from which products, and at what margin? A launch can add revenue while initially consuming cash through inventory, promotion and market access work. Top-line contribution alone does not determine shareholder value. [2]
Portfolio management also involves exiting products. Harrow completed its acquisition of Tyrvaya rights outside Japan on October 1 and announced the closing on October 5. Viatris received $30 million in cash, with up to $70 million of additional payments contingent on specified sales thresholds. Viatris retained Japan rights and owes Harrow royalties on any future Japanese net sales. The August financial update had recorded a related $177.8 million impairment. Closing is now established; the contingent receipts remain uncertain. [2] [18] [19]
Taken together, launches, licenses and disposals make comparisons between periods more demanding. Investors should distinguish underlying demand from currency effects, new products, divestitures and any future acquisition consolidation. A useful operating dashboard follows the revenue bridge and the cash bridge together. It asks not only what was launched, but whether launch spending, product returns and working-capital requirements are consistent with the returns initially expected.
09 Earnings quality: GAAP results versus adjusted measures
For the second quarter of 2026, Viatris reported approximately $3.8 billion of revenue, a GAAP net loss of $118.8 million and GAAP loss per share of $0.10. At the same time, adjusted earnings per share were $0.69 and adjusted EBITDA was $1,188.3 million. These figures are not contradictory; they reflect different definitions and adjustments. An investor should understand the reconciliation before deciding which measure is most useful for a particular valuation question. [2]
The gap is substantial enough that an “earnings multiple” needs a clear denominator. A multiple of adjusted EPS measures the price against management’s adjusted profitability framework. It is not a multiple of the quarter’s GAAP result. Adjustments can improve comparability when they remove specific accounting effects, but recurring restructuring, acquisition activity and other cash charges still matter to shareholders. The analytical task is to identify what is noncash, what is genuinely unusual and what repeatedly consumes resources.
The gross-profit figures show the same distinction. Reported gross profit was $1,456.5 million, or 38.8% of revenue, while adjusted gross profit was $2,158.9 million, or 57.5%. A margin discussion that switches between these bases can produce a misleading picture of improvement or deterioration. Comparisons are meaningful only with the same definition across periods, and changes need to be separated into business-mix effects and accounting or adjustment effects. [2]
For the first half, total revenue was $7,273.8 million and GAAP net earnings were $57.6 million, with GAAP EPS of $0.05. Adjusted net earnings were $1,502.6 million, adjusted EPS was $1.28 and adjusted EBITDA was $2,237.8 million. These year-to-date numbers provide a broader view than a single quarter, while preserving the same need to examine the gap between reported and adjusted profitability. Neither basis should be hidden because it complicates the investment story. [2]
The Pacira transaction introduces another future comparability issue. Acquisition accounting, financing and integration can affect reported results differently from adjusted guidance metrics. Management’s expectation of accretion should therefore be followed by the actual definitions and reconciliations supplied after closing. Without those details, it is premature to describe the deal as improving every earnings measure or to insert a precise accretion estimate into a model.
The most informative evidence over time would be a narrowing gap between durable operating performance and cash retained after necessary spending. Adjusted measures remain useful when consistently defined and paired with cash-flow analysis. They become less useful when they are treated as the only economic truth. For VTRS, both the established portfolio and the transition strategy need to demonstrate that accounting earnings can translate into cash available for debt, investment and shareholder returns.
10 Cash generation, working capital and financial flexibility
The second-quarter cash-flow bridge begins with $381.8 million of GAAP operating cash flow. After $52.8 million of capital expenditure, free cash flow was $329.0 million. The company also reported $449 million of free cash flow excluding transaction and restructuring costs. The approximately $120 million difference is economically relevant: the higher figure describes an adjusted view, while the lower figure reflects those cash costs in the period. The two measures are distinct and labeled as such. [2]
For the first half, operating cash flow was $770.1 million and capital expenditure was $92.7 million, producing $677.4 million of free cash flow. The adjusted measure excluding transaction and restructuring costs was approximately $908 million. These figures show why adjusted EBITDA cannot be treated as cash available for immediate distribution. Interest, taxes, working-capital movements, capital expenditure and other cash items intervene between operating profit measures and the amount left for capital allocation. [2]
Cash and cash equivalents were $886.5 million at June 30. That is a balance-sheet snapshot, not a statement of October liquidity. Receivables, inventory and other current assets are also important to the operating cycle, but cannot be treated as interchangeable with cash in the bank. Receivables must be collected and inventory must be sold under commercially viable conditions. A business can report substantial current assets while still needing careful cash management.
The acquisition funding language reinforces the date distinction. An October statement that a transaction will be funded mainly from excess cash does not mean that the June cash balance should be mechanically reduced by the full announced purchase price. Cash is generated and used between those dates, and the financing plan includes short-term borrowing. A proper pro forma balance sheet requires updated balances, the actual purchase accounting and the final financing terms. [1] [2]
Working capital can also make quarterly cash generation uneven. Inventory builds before launches, payment timing and collections can shift cash between periods without equivalent changes in underlying demand. Conversely, a favorable working-capital release can temporarily improve cash flow without representing a permanent increase in profitability. The right comparison follows several periods and asks whether the cash conversion pattern is consistent with the company’s guidance and operational explanations.
For shareholders, financial flexibility is the ability to fund the business through an adverse period without abandoning valuable investment or accepting unnecessarily expensive financing. Viatris has a substantial operating business, but also debt service, shareholder distributions and acquisition ambitions. Those uses compete for the same cash. The quality of the strategy should be assessed by how management balances them when conditions are less favorable, not only by the size of the adjusted cash-flow target in a presentation.
11 Debt, capital allocation and the dividend
The August 6 update reports July proceeds of approximately $380 million before tax from selling the Biocon Limited equity position, completing roughly $780 million of total monetization of the Biocon Biologics stake. Viatris second-quarter 2026 results release.
The June-quarter 10-Q cover reports 1,148,590,864 common shares outstanding as of August 3, 2026. This dated corporate count is distinct from a market-data provider’s later share or capitalization figure. Viatris Form 10-Q, SEC filing.
The June balance sheet reported $11,612.4 million of long-term debt and $1,738.9 million in the broader line covering the current portion of long-term debt and other long-term obligations. The wording of that current line matters: it should not automatically be described as pure debt without consulting the filing’s debt note. Carrying amounts, principal maturities and a company’s leverage ratio can also use different definitions. Comparing them requires a reconciliation rather than an assumption that every debt number measures the same thing. [2] [15]
In June, Viatris repaid approximately $900 million of debt and refinanced other obligations with €650 million of notes carrying a 4.25% coupon and maturing in 2033. The currency denomination is material; the euro principal cannot be restated in dollars without an exchange-rate assumption. Refinancing can extend maturities and improve near-term flexibility, while leaving the company exposed to interest costs and the need to generate cash over the life of the debt. [2]
Management reported a gross leverage ratio of approximately 2.9 times in the second-quarter update. This is a company metric with its own defined denominator, not directly comparable with a ratio calculated from a single quarter of GAAP income. A future acquisition may change both debt and the earnings base. The claim of minimal leverage impact from Pacira remains an expectation until the financing and combined results can be observed. [1] [2]
Shareholder returns are another cash commitment. Through August 5, Viatris reported approximately $550 million returned to shareholders, including approximately $270 million of repurchases at a weighted average price of $16.42. The remaining buyback authorization was approximately $730 million. An authorization permits repurchases; it does not obligate management to spend the entire amount or establish that those purchases have occurred. Repurchases should be evaluated alongside debt and investment needs. [2]
The board’s August dividend declaration was $0.12 per share, payable September 16 to holders of record on August 21. Four payments at that quarterly rate would equal $0.48 annually. Relative to the $17.44 reference price, that is an illustrative annualized yield of approximately 2.75%. It is not a promise of future declarations, and the historical payment is not a dividend still awaiting distribution in October. [10] [11]
The capital-allocation test is whether acquisitions, development spending, debt reduction and distributions collectively improve value per share. Buybacks can reduce the share count, but do not automatically compensate for a weak return on a large acquisition. A dividend can provide cash to holders, but does not remove operating risk. Management’s choices should be judged as a connected allocation of resources, with financing costs and the opportunity cost of capital made explicit.
12 Manufacturing, regulation and risks in the base business
Manufacturing quality is a material investment issue even for a diversified pharmaceutical company. The August update discussed an FDA inspection at the Nashik facility in India in May that resulted in Form 483 observations. Viatris described remediation work involving third-party experts. A Form 483 records inspection observations; it is not a Warning Letter. The actual regulatory documents and subsequent company disclosures determine whether the situation changes. [2]
The same update described a February fire, a temporary production suspension and intermittent supply disruptions, with production resumed. Management expected a second-half revenue impact of approximately $100 million to $150 million. This is a company estimate, not a final realized loss. The operational question is whether supply normalizes within the assumptions embedded in the outlook, and whether remediation or production constraints introduce additional costs or delays. [2]
It is useful to distinguish the mechanisms involved. A plant disruption can reduce available product, delay customer deliveries and alter inventory needs. Quality remediation can require spending even after production resumes. Regulatory action can affect what is permitted to be manufactured or distributed. These outcomes are related, but not identical. An announcement that production has resumed is encouraging without necessarily proving that every commercial and regulatory consequence has ended.
The broader portfolio also faces pricing and competitive pressures. Established brands can remain valuable while their economics change across markets. Generics can experience competition, tender pressure and shifts in supply. Currency can affect reported growth even when local demand is stable. These factors are especially relevant when a bullish thesis focuses heavily on a few new products: the base business must continue producing the cash needed to fund the transition.
Acquisition integration adds another layer of execution. Commercial teams, systems, supply arrangements and compliance processes need to work together. Prospective synergies should be weighed against integration spending and disruption risk. The fact that both companies operate in healthcare does not make their operating models automatically interchangeable. A credible integration plan should eventually translate into measurable results, with enough disclosure to distinguish organic performance from acquisition contribution.
The practical monitoring priorities are therefore specific: updates to the Nashik estimate, product availability, the relationship between reported and operational sales growth, launch spending and the consistency of cash conversion. Broad reassurance about scale is less informative than evidence that these operating issues are improving. Equally, an isolated setback should be assessed for its actual financial scope instead of being extrapolated into a claim that the entire portfolio is impaired.
13 Market data, trading conditions and outside opinion
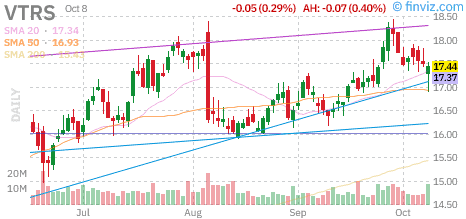
The Finviz API snapshot used here refers to the October 8, 2026 regular-session close of $17.44, down 0.29% for the session. Reported daily volume was 14,110,099 shares. The daily range was $16.89 to $17.52, with an opening price of $17.26. These are dated observations, not a live executable quote. The accompanying daily chart is a dated market reference and may not include later trading or subsequent news. [11]
Finviz reported market capitalization of approximately $20.03 billion. This places VTRS at a very different scale from small development-stage companies approaching binary FDA events. It remains included in this research series as an explicitly selected exception. Market capitalization measures equity value; it excludes the adjustments needed to derive enterprise value. A comparison with a smaller company should therefore consider both the scale of existing operations and the capital structure.
The ownership snapshot reported institutional ownership of 92.17%, insider ownership of 2.07% and short float of 3.63%. Such fields can have different underlying reporting dates and methodological definitions. They are not simultaneous real-time holdings, cannot be added mechanically to reconstruct an exact shareholder register, and do not by themselves predict a squeeze. The reported short ratio of 4.45 is a trading statistic, not a timetable within which positions must close. [11]
The useful role of market and opinion data is to test expectations against operating evidence. A share-price advance may indicate greater optimism, but does not reveal exactly which future outcome is priced in. A low valuation ratio may indicate opportunity or skepticism about durability. The research process should therefore keep the tape, the accounting and the clinical evidence in separate columns before considering how they interact.
14 Valuation framework and catalyst sensitivity
At the $17.44 reference price, dividing by the midpoint of the August adjusted EPS guidance, $2.52, gives approximately 6.9 times. This is a simple price-to-guided-adjusted-earnings calculation. It is not a GAAP earnings multiple, not a verified analyst consensus multiple and not a pro forma valuation of a completed Pacira acquisition. The data source’s separate forward P/E figure can differ because its estimate base and horizon are different. Both calculations need an explicit denominator. [2] [11]
The August guidance range was $14.55 billion to $14.95 billion of revenue, $4.3 billion to $4.5 billion of adjusted EBITDA and $2.45 to $2.59 of adjusted EPS. Management also guided to $2.05 billion to $2.35 billion of free cash flow excluding transaction and restructuring costs, alongside $1.9 billion to $2.1 billion of GAAP operating cash flow. The two cash measures are not interchangeable. They represent different points and adjustments in the cash-flow bridge. [2]
Using the approximately $20.03 billion equity value and the $2.2 billion midpoint of adjusted free-cash-flow guidance produces an illustrative yield of roughly 11%. That is an equity-value comparison against an adjusted prospective measure. It does not represent cash already available for distribution, and it excludes the economic effect of costs that the guidance measure removes. The number is a starting point for asking whether the cash generation is durable, not a sufficient reason to conclude that the stock is undervalued.
An operating scenario framework is more useful than a single unsupported price target. In a constructive case, the established portfolio remains resilient, manufacturing disruption stays within expectations, new products contribute and the Pacira transaction closes with manageable integration costs. In a middle case, the base business supports cash generation but launch progress is gradual and the acquisition needs time to demonstrate returns. In a downside case, operating pressure and launch delays coincide with integration spending and reduce financial flexibility. These are editorial scenarios, not company guidance or probability-weighted forecasts.
The PDUFA dates can influence price through changes in expected revenue, timing, launch spending and confidence in the broader strategy. A favorable decision can still be followed by a muted share reaction if expectations were already optimistic. An unfavorable decision can affect more than the product’s immediate sales estimate if it changes views on execution. Neither reaction can be calculated reliably from the calendar date alone. Market expectations and the details of the decision are essential.
For this reason, the hub assigns no precise percentage upside to approval and no invented probability of success. A defensible valuation would require product-level assumptions for net pricing, access, adoption, margins, royalties, development costs and capital allocation. Until those assumptions are explicit, a dramatic target price would provide more apparent precision than actual information. The evidence supports an event-rich transition story; the return available to shareholders still depends on the price paid and the cash ultimately earned.
15 Calendar and the evidence that should change the thesis
October 17 is the stated FDA target for phentolamine in presbyopia. The first task after any decision is to read the primary announcement and, where available, the FDA label or decision documentation. The outcome should then be translated into the actual indication, limitations, launch timing and financial implications. A headline containing the word “approval” is not enough to fill every field in a commercial model. [3]
November 5 is the announced date for Viatris’s third-quarter financial results and an 8:30 a.m. Eastern Time webcast. That update offers an opportunity to compare operating performance with the August outlook and to look for additional information on the Pacira transaction. Particularly useful items would include cash generation, the manufacturing impact, new-product sales, financing assumptions and any changes to guidance. The event is an earnings disclosure, not another FDA decision. [13]
December 27 is the stated FDA target for the acute-pain meloxicam application. The study evidence discussed in this hub supports the submission rationale but does not predetermine the decision. A delay, request for more information or unfavorable outcome would need to be evaluated on its specific grounds. Manufacturing, clinical, labeling and administrative issues can have different implications; the reason for a regulatory outcome matters as much as the initial headline. [4]
The expected Pacira closing by year-end is a separate corporate milestone. Confirmation of closing, the financing used and the eventual combined outlook would improve the basis for financial analysis. Until then, Pacira’s historical results remain a reference for the proposed acquisition rather than part of Viatris’s reported first-half accounts. After closing, subsequent quarters would test whether integration and product performance support the strategic rationale. [1]
Beyond 2026, the targeted first-half 2027 cenerimod readouts are important scientific events. They should be monitored independently from the two near-term product decisions. Changes in those timelines, new trial results or revised development plans could alter the longer-term pipeline contribution. Keeping a dated record of each milestone prevents an old target from being repeated indefinitely as if it had been freshly confirmed. [8]
Evidence that would strengthen the thesis includes consistent cash conversion, launches with sustainable economics, operating disruptions resolving within stated assumptions and acquisitions producing measurable returns. Evidence that would weaken it includes repeated cash adjustments, worsening supply constraints, expensive integration without commensurate growth or material clinical setbacks. This framework makes the hub updateable: new information should change specific assumptions, rather than trigger an unstructured rewrite of the entire investment story.
Sources and research references
Primary disclosures control facts. Finviz supplies dated market data. Consensus research records were fetched before use; publication design and limitations remain explicit.
[1] Viatris: agreement to acquire Pacira, October 8, 2026[2] Viatris: Q2 2026 results, GAAP and adjusted reconciliations, August 6[3] Viatris: phentolamine presbyopia sNDA and October 17 target, February 25[4] Viatris: fast-acting meloxicam NDA and December 27 target, May 18[5] Viatris Form 8-K and Pacira merger agreement, October 8, 2026[6] Bertoch et al., Pain and Therapy 15:1483–1498 (2026), bunionectomy Phase 3; DOI 10.1007/s40122-026-00870-7[7] Hummel et al., Expert Opinion on Drug Delivery 22:1977–1984 (2025), pharmacokinetics; DOI 10.1080/17425247.2025.2561710[8] Viatris pipeline: explicitly dated August 6, 2026; later asset releases supersede this snapshot[9] Viatris: Japanese WAKIX approval and Japan commercial rights, September 16[10] Viatris: quarterly dividend declaration, August 4, 2026[11] Finviz VTRS; API snapshot, October 8, 2026 regular-session close[13] Viatris: Q3 results scheduled November 5, release October 5, 2026[14] Opus Genetics Form 10-Q, June 30, 2026: Viatris license economics[15] Viatris Form 10-Q, quarter ended June 30, 2026[16] Consensus fetched record: Bertoch et al., 2026; 0 citations at retrieval[17] Consensus fetched record: Hummel et al., 2025; 1 citation at retrieval[18] Harrow: Tyrvaya acquisition closing announced October 5, 2026[19] Harrow Form 8-K: October 1 closing and retained Japan rights, filed October 5Frequently asked questions about Viatris stock
What are the next Viatris PDUFA dates?
The company has stated October 17, 2026, for phentolamine ophthalmic solution 0.75% in presbyopia and December 27, 2026, for fast-acting oral meloxicam in moderate-to-severe acute pain. These are FDA target action dates, not guaranteed approvals or commercial launch dates. [3] [4]
Has Viatris already acquired Pacira?
As of this hub’s October 9 verification, Viatris has announced a definitive agreement. The company expects closing by year-end, subject to the tender offer, regulatory and other conditions. The $1.65 billion headline is aggregate equity value, not enterprise value. [1]
Could these catalysts move VTRS stock?
Yes, if they change expectations for future cash flow, timing or execution. The size and direction of a share-price reaction cannot be inferred from a PDUFA date alone. VTRS also has a large established operating business, so the economic concentration differs from that of a small single-asset biotechnology company.
Is phentolamine already approved for presbyopia?
The presbyopia indication remains under review in the sources verified for this hub. The existing Ryzumvi approval concerns reversal of pharmacologically induced mydriasis. Approval in one indication is not approval in another. [3]
Does the meloxicam study prove superiority to tramadol?
The pivotal efficacy comparison was against placebo. The published bunionectomy report’s exploratory tramadol comparison was not a powered confirmatory superiority test. It is not definitive head-to-head proof. The study supports efficacy in its observed setting, with the design limitations described in Chapter 06. [4] [6]
Why is adjusted profit positive while GAAP profit is weak?
The measures include different adjustments. Viatris reported a second-quarter GAAP loss alongside positive adjusted EPS. The reconciliation and the cash-flow statement are necessary to understand the difference. Each figure needs its definition, and one cannot replace the other. [2]
Is the dividend yield guaranteed?
No. The approximately 2.75% illustration annualizes a $0.12 quarterly rate and divides by the dated $17.44 share price. Future declarations remain board decisions, and both the share price and distribution policy can change. The September payment is historical, not a new October entitlement. [10] [11]
What is the most important risk to monitor?
There is no single risk that explains the whole company. Manufacturing execution, launch economics, debt and capital allocation, acquisition integration and clinical outcomes all matter. The immediate calendar provides useful checkpoints, while durable cash generation remains central to evaluating the broader transition.
 Umbria