DISCLAIMER — Not financial advice. Educational content only, not an offer or solicitation to buy or sell any security. Biotech and small/mid-cap stocks are highly speculative and volatile and can result in a partial or total loss of capital. Do your own research and consult a licensed advisor where appropriate.
Tools I Use
Real-Time Market Scanner
Fast movers • Alerts • Momentum
10% OFF with SAVE10
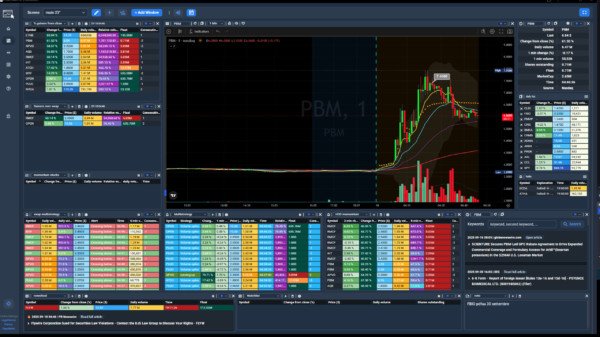
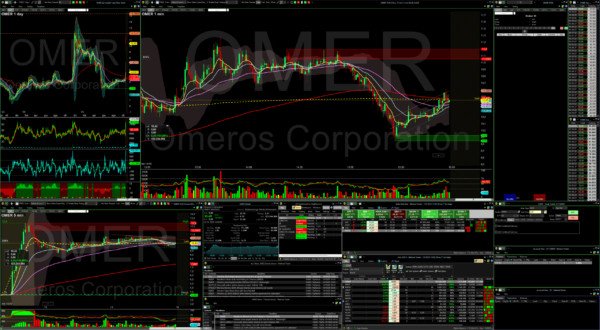
Recommended Platform

Professional Trading Workflow
Charts • Watchlists • Multi-broker tools
Built for active traders
Merlintrader Trading Pub
Biotech catalyst, news and analysis PDUFA tracker
Merlintrader Trading Pub
Biotech catalyst, news and analysis PDUFA tracker
Biotech Valuation Framework 2025
Educational guide to market cap analysis, peak sales and probability-adjusted valuation
Reading time: 14–18 minutes | Words: 4,000+
Educational only: this chapter does not provide investment advice, trading signals or guarantees of results. Any decision to buy, sell or hold a security remains entirely your responsibility.
Quick navigation
1. Why valuation matters 2. Market cap by development stage 3. Estimating peak sales 4. Valuation multiples 5. Thinking in probabilities 6. DCF logic (simplified) 7. Illustrative valuation examples 8. How traders use valuation signals1. Why biotech valuation matters
In biotech, much of the value of a company rests on expectations about the future – future approvals, future peak sales and future competitive dynamics. Prices move not only on clinical news, but also on how that news shifts the market’s view of long-term cash flows.
Unlike mature sectors with predictable earnings, early-stage biotech companies often have little or no current revenue. Their valuation is therefore anchored to probability-weighted scenarios about what could happen several years ahead. Having at least a rough framework for this helps interpret whether a given reaction looks proportionate or stretched.
Key idea: valuation is not about achieving perfect precision. It is about understanding whether the current price implies very optimistic, very pessimistic or moderate assumptions about the company’s future.
2. Market cap by development stage
The same potential peak sales can justify very different market caps depending on how far a program has advanced and how much risk remains. The table below summarises typical ranges seen in the market (purely illustrative, not rules):
| Stage | Indicative market cap range | Typical cash runway | Risk profile | Common market narrative |
|---|---|---|---|---|
| Preclinical / Phase 1 | ~$50M–$300M | 2–3 years | Very high (most programs never reach approval) | Platform potential, early proof-of-concept stories. |
| Phase 2 | ~$200M–$800M | 2–3 years | High (significant attrition remains) | “Emerging data”, first look at efficacy in patients. |
| Phase 3 (ongoing) | ~$500M–$2B | 2–4 years | Moderate (large, expensive confirmatory trials under way) | Binary readout risk dominates the story. |
| Positive Phase 3 / pre-approval | ~$1B–$3B | 1–2 years to potential approval | Lower, though regulatory and commercial risks remain | Focus shifts from “if” to “how big” and “how fast”. |
| Approved, commercial stage | $2B–$10B+ (heavily sales-dependent) | Often self-funded | Lower still; execution and competition become key | Valuation anchored to sales growth and margins. |
Ranges above are indicative and drawn from past market observations. Actual valuations can fall outside these bands depending on pipeline depth, partnerships, balance sheet and sentiment.
3. Estimating peak sales
Peak sales represent the approximate maximum annual revenue a product could generate once it has reached a mature level of adoption. A common back-of-the-envelope approach is:
Peak sales ≈ patient population × treatment penetration × average annual price per patient.
Illustrative example
- Total diagnosed population in target geography.
- Proportion likely to be eligible and appropriate for the new therapy.
- Reasonable market-share assumption over time, taking into account competitors.
- Net annual price per treated patient (after discounts and rebates).
The result is rarely a single precise number. More usefully, valuation work often uses a range (for example low/central/high peak sales scenarios) which then flow into valuation calculations.
4. Valuation multiples
In practice, many market participants rely on valuation multiples as a shorthand, especially when detailed DCF models are not available. Two common anchors are “value as a percentage of peak sales” and “value as a multiple of current revenue” (for commercial-stage companies).
| Metric | Typical range – earlier stage | Typical range – commercial stage | Comments |
|---|---|---|---|
| Value as % of peak sales | Roughly 0.5–2× peak sales, depending on risk | Roughly 3–5× peak sales for well-established products | Higher percentages require conviction on durability and margins. |
| Current revenue multiple | N/A (little or no revenue) | Often 5–10× revenue for high-growth launches | Multiples compress as growth normalises. |
These are descriptive ranges, not targets. Different sub-sectors (gene therapy, vaccines, specialty pharma, etc.) may trade on different benchmarks.
5. Thinking in probabilities
For pipeline assets, many analysts combine peak-sales thinking with an explicit probability of success. A simple framework uses an “expected value” calculation:
Expected asset value = probability of success × value in success scenario.
For example, a program that might be worth $2 billion to the company if approved and commercialised, but is deemed to have a 40% chance of eventual success, might be assigned an “expected” value of around $800 million, before adjusting for time value and dilution.
Perspective: different investors can reasonably assign different probabilities. The key advantage of this approach is not the exact number, but the discipline of making assumptions explicit.
6. DCF logic (very simplified)
A discounted cash-flow (DCF) model projects future cash flows and discounts them back to today at a rate that reflects risk. In biotech, full DCF models can be complex, but the basic structure is:
Company value ≈ Σ (future free cash flowt ÷ (1 + discount rate)t).
For educational purposes, a simple DCF for a launch might project revenue and margins for the first 5–10 years, apply a terminal value and discount everything at a rate in the mid-teens (often 12–18% for development-stage biotech). The resulting range gives a sense of whether current market cap implies aggressive or conservative assumptions about growth and profitability.
7. Illustrative valuation examples
Example A – Commercial-stage company with a recent launch
- Market cap around 40–50% of central peak-sales estimate.
- Strong cash position covering several years of operations.
- Early sales tracking above internal guidance.
- Market interpretation: valuation appears broadly consistent with a successful launch scenario, leaving upside mainly if peak-sales assumptions are revised higher.
Example B – Development-stage company ahead of a pivotal readout
- Market cap already close to, or above, central success-case valuation derived from peak sales.
- Binary Phase 3 risk still ahead with meaningful uncertainty on endpoints or safety.
- Market interpretation: pricing implies a high probability of success; negative or even mixed data could lead to a large de-rating.
Real tickers are omitted here on purpose; the logic is what matters. Any real-world case requires a full review of filings, data presentations and competitive context.
8. How traders use valuation signals (descriptive)
Active traders often combine valuation work with catalysts to decide where to focus attention. Some of the patterns that appear repeatedly:
- Names trading at a low percentage of conservative peak-sales estimates sometimes attract “value with catalyst” interest, especially if near news events that could reduce uncertainty.
- Names trading at a very high percentage of optimistic peak-sales estimates ahead of binary events may be seen as crowded or vulnerable to disappointment.
- Rapid pre-catalyst reratings (for example, 40–50% moves in a few weeks) are often treated with caution by risk-aware traders, who pay close attention to position sizing and downside scenarios.
- Balance-sheet strength (cash vs burn) is frequently considered alongside valuation: companies with short runways may need to raise capital, which can affect the per-share outcome even in success scenarios.
These observations describe market behaviour; they are not individual recommendations. Any investment decision should consider personal objectives, risk tolerance and, where appropriate, independent professional advice.
Biotech Catalyst Calendar
This lesson is part of a multi-day educational course on catalyst-driven biotech investing. To explore upcoming trial readouts, PDUFA dates and other events, you can consult the dedicated calendar on Merlintrader.