DISCLAIMER — Not financial advice. Educational content only, not an offer or solicitation to buy or sell any security. Biotech and small/mid-cap stocks are highly speculative and volatile and can result in a partial or total loss of capital. Do your own research and consult a licensed advisor where appropriate.
Tools I Use
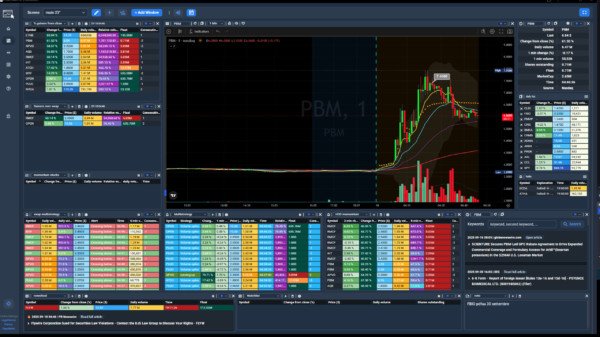
Real-Time Market Scanner
Fast movers • Alerts • Momentum
10% OFF with SAVE10
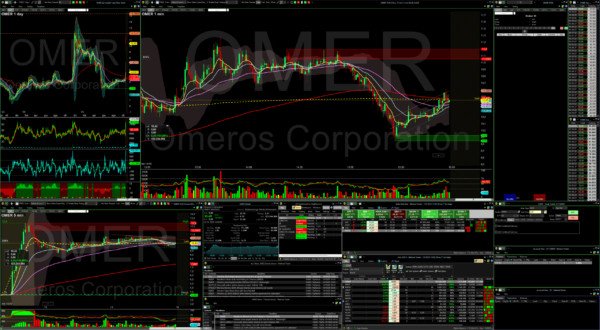
Recommended Platform

Professional Trading Workflow
Charts • Watchlists • Multi-broker tools
Built for active traders
Merlintrader Trading Pub
Biotech catalyst, news and analysis PDUFA tracker
Merlintrader Trading Pub
Biotech catalyst, news and analysis PDUFA tracker
Biotech Catalyst Trading Guide 2025
Educational overview of FDA, clinical data, earnings and partnership catalysts for small-cap biotech
Reading time: 12–15 minutes | Words: 3,200+
Educational only: this guide does not provide investment advice, trading signals or guarantees of results. Any decision to buy, sell or hold a security remains entirely your responsibility.
Quick Navigation
1. What is a Biotech Catalyst 2. Types of Biotech Catalysts 3. FDA Catalysts (PDUFA & BLA) 4. Clinical Data Catalysts 5. Earnings & Financial Catalysts 6. Partnership & Collaboration Catalysts 7. Conference & Presentation Catalysts 8. Market Impact Patterns 9. Common Trading Approaches 10. Real-World Examples (AGIO, NUVB) Conclusion1. What is a Biotech Catalyst?
A catalyst is a discrete event that can materially change market perception of a biotech company’s prospects. In biotech, catalysts often determine whether a drug moves forward, stalls or fails. This is why biotech catalysts frequently create extreme price volatility, sometimes in the order of ±20–50% in a single session.
Unlike many traditional sectors where catalysts are mostly about guidance and trends, biotech catalysts are often binary events: a trial either meets its primary endpoint or it does not, an FDA decision is either approval or rejection, a partnership closes or falls through. This binary nature is what attracts traders but also concentrates risk.
Key concept: catalysts do not “predict” the future — they reveal it. Once the press release is out, the uncertainty collapses and the price adjusts, sometimes violently. The edge comes from preparing before the event and understanding the range of plausible outcomes.
2. Types of Biotech Catalysts (Indicative Impact)
| Catalyst Type | Typical Stock Impact | Frequency | Trader Priority |
|---|---|---|---|
| FDA Approval Decision (PDUFA) | ≈ ±40–100% | Often 0–1x/year (more only for multi-product companies) | Very High |
| Phase 3 Trial Results | ≈ ±30–80% | 1–2x/year per program | Very High |
| Phase 2 Trial Results | ≈ ±20–50% | 2–4x/year per program | Medium–High |
| Earnings Release | ≈ ±15–40% (if surprise) | 4x/year | Medium |
| Partnership / Collaboration | ≈ ±20–60% (varies) | 1–3x/year | Medium–High |
| Conference Presentation | ≈ ±10–30% | Several times/year | Medium |
| Executive Change | ≈ ±15–40% (varies) | Sporadic | Medium |
| Patent / IP Decision | ≈ ±25–70% (varies) | Sporadic | Medium–High |
The impact ranges above are indicative and based on past examples. They are not predictions of future performance and may differ significantly from case to case.
3. FDA Catalysts — PDUFA Decisions
FDA approval is a critical inflection point for many biotech companies, because without it a drug generally cannot be commercialised in the United States. The PDUFA date (Prescription Drug User Fee Act) is the formal deadline by which the FDA aims to complete its review.
PDUFA Review Timelines
- Priority Review (about 6 months): reserved for therapies that may offer significant improvements. Price often starts to move more noticeably 4–8 weeks before the decision.
- Standard Review (about 10 months): the default timeline. Moves can start earlier and be more gradual, sometimes 8–12 weeks ahead of the date.
Approval Probabilities
Recent public FDA statistics suggest that approval rates vary by indication and modality. Oncology and rare-disease drugs have historically shown relatively high approval percentages, while more crowded or less differentiated areas tend to be tougher. These figures change over time and should always be checked against the most recent official data.
Risk reminder: strong Phase 3 data can still result in a Complete Response Letter (CRL) if the FDA has concerns about safety, trial design, manufacturing or benefit-risk balance. A common error among retail traders is treating PDUFA decisions as “almost guaranteed” based solely on headline efficacy.
4. Clinical Trial Catalysts
Clinical trial readouts are among the most powerful catalysts. A successful Phase 3 can re-rate a company; a failed trial can cut the equity value dramatically.
Understanding Trial Phases
- Phase 1: safety and dosing in a small number of volunteers. Market impact usually modest.
- Phase 2: first real look at efficacy in patients. Market impact medium; results often guide whether Phase 3 is justified.
- Phase 3: large, confirmatory trials. Often the highest impact events in a program’s life cycle.
- Phase 4: post-approval monitoring, usually lower immediate impact unless safety issues emerge.
Primary vs Secondary Endpoints
| Endpoint Type | Definition | Market Relevance |
|---|---|---|
| Primary Endpoint | Main outcome the trial is powered to detect. Success here is usually essential for the trial to be called “positive”. | Critical |
| Secondary Endpoints | Additional outcomes of interest (quality of life, secondary symptoms, etc.). They can strongly influence how regulators, physicians and investors interpret the overall benefit. | Important |
| Safety Data | Adverse events, serious adverse events, discontinuations and deaths. | Important |
Case study – AGIO RISE UP (Nov 19, 2025):
Primary endpoint met (hemoglobin response), but key secondary endpoints related to pain crises and fatigue were not clearly improved. The market reaction was a sharp re-rating to the downside, showing how missing clinically meaningful outcomes can outweigh a single positive biomarker.
Primary endpoint met (hemoglobin response), but key secondary endpoints related to pain crises and fatigue were not clearly improved. The market reaction was a sharp re-rating to the downside, showing how missing clinically meaningful outcomes can outweigh a single positive biomarker.
5. Earnings and Financial Catalysts
Quarterly earnings can also be meaningful catalysts, especially once a company has an approved product. For commercial-stage biotech, the story gradually shifts from “Can they get approval?” to “Can they execute and grow?”
Key Earnings Line Items
- Product revenue: how actual sales compare with consensus and with company guidance.
- Cash position and runway: roughly how many quarters of operating cash the company has left at the current burn.
- Operating expenses: research and development plus SG&A trends, which affect dilution risk.
- Catalyst guidance: clarity on upcoming trials, PDUFA dates and regulatory submissions.
Illustrative example – NUVB Q3 2025: revenue well ahead of expectations, solid early uptake for IBTROZI and a strong cash position combined to reinforce confidence in the commercial story. The reaction was not just the day-one move, but a sustained trend supported by later quarters.
6. Partnership & Collaboration Catalysts
Strategic partnerships, licensing deals and M&A can all reframe a valuation. A large-pharma partner effectively “votes” on the asset, adding credibility, cash and optionality.
- Co-development deals: both sides share costs and milestones; often read as external validation.
- Licensing agreements: biotech may receive upfront payments, milestones and royalties in exchange for regional rights.
- Acquisitions: buyers typically pay a premium over the pre-deal trading price, but once the deal is public, upside can become capped at the offer terms.
7. Conference & Presentation Catalysts
Major conferences (ASCO, ASH, ESMO and others) can be catalysts when new or fuller data are presented. Sometimes the headline numbers are known from a press release, but details at the conference (subgroup data, safety, durability) can still move the stock.
8. Typical Market Impact Patterns
Although every situation is different, many biotech catalysts tend to follow some recurring patterns:
- Pre-catalyst phase (4–8 weeks before): speculation and positioning build. If sentiment is optimistic, prices may drift higher and volume increases.
- Catalyst day: volatility spikes as the news is released. Initial moves can be large in both directions.
- Post-catalyst fade (first few sessions): the market reassesses details beyond the headline; gains or losses often retrace part of the initial move.
- Stabilisation (after week one or two): a new equilibrium is found based on the deeper analysis of data, competitive landscape and financing needs.
9. Common Trading Approaches Around Catalysts
This section describes typical approaches used by active traders around catalysts. They are not recommendations, just a map of what is commonly done in the market.
Practices Often Used by Experienced Traders
- Calendar tracking: maintaining a watchlist of upcoming catalysts (for example via tools like the Merlintrader Catalyst Calendar) to avoid being surprised by dates.
- Volatility awareness: monitoring implied volatility and past reactions to similar events to get a sense of potential trading ranges.
- Pre-event position management: many short-term traders prefer to reduce or fully close positions before the binary event, focusing on the “run-up” rather than on the outcome itself.
- Diversification: spreading exposure across several uncorrelated catalysts instead of concentrating risk in one single name.
- Post-mortem analysis: after each catalyst, reviewing what was anticipated correctly and what was missed to refine the personal playbook.
Behaviours That Often Increase Risk
- Building oversized positions in a single binary event.
- Ignoring secondary endpoints or safety details and focusing only on a single metric.
- Treating regulatory decisions as guaranteed outcomes based on social-media sentiment.
- Relying purely on leverage or options without understanding gap risk.
- Trading without any predefined risk limit or exit plan.
The elements above are examples of how some market participants behave and are provided for information only. They are not a personalised strategy and may be unsuitable or too risky for many investors.
10. Real-World Examples: AGIO and NUVB
Example 1 – AGIO and the RISE UP trial:
- Catalyst: Phase 3 RISE UP data in sickle-cell disease.
- Set-up: progressive share-price appreciation into the event as expectations built.
- Outcome: primary endpoint formally positive, but key secondary clinical outcomes were disappointing.
- Market reaction: sharp downward re-rating, showing how the market weighs clinical benefit more than isolated biomarkers.
Example 2 – NUVB and IBTROZI approval:
- Catalyst: FDA approval for IBTROZI in polycythaemia vera.
- Set-up: moderate run-up into the decision as confidence increased.
- Outcome: approval followed by stronger-than-expected early sales and a strong cash runway.
- Market reaction: positive reaction around the decision and further support from earnings, leading to strong performance over the year.
Conclusion: Using Catalyst Knowledge Responsibly
Biotech catalysts are central drivers of volatility in the sector. Understanding what they are, how they work and how markets have reacted historically can help investors and traders frame scenarios more clearly. The same knowledge also highlights how concentrated and asymmetric the risks can be.
For those who choose to operate in this space, the combination of solid fundamental research, realistic expectations and strict risk management is more important than any single event. No framework eliminates risk, but an informed approach can make that risk more visible and deliberate.
Always cross-check catalyst information with official sources (SEC filings, FDA documents, company press releases) and consider independent professional advice before taking financial decisions.
Biotech Catalyst Calendar
To explore upcoming FDA, clinical and other key events across dozens of tickers, you can consult the dedicated calendar maintained on Merlintrader.