DISCLAIMER — Not financial advice. Educational content only, not an offer or solicitation to buy or sell any security. Biotech and small/mid-cap stocks are highly speculative and volatile and can result in a partial or total loss of capital. Do your own research and consult a licensed advisor where appropriate.
Tools I Use
Real-Time Market Scanner
Fast movers • Alerts • Momentum
10% OFF with SAVE10
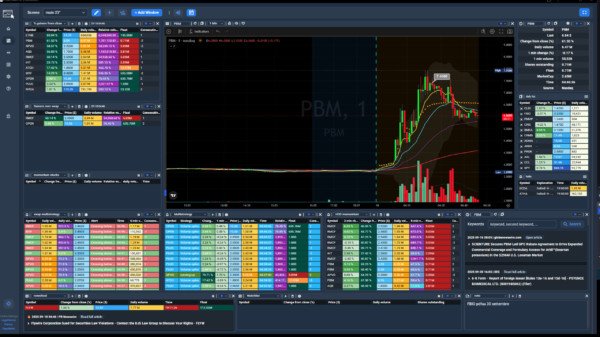
Recommended Platform

Professional Trading Workflow
Charts • Watchlists • Multi-broker tools
Built for active traders
Merlintrader Trading Pub
Biotech catalyst, news and analysis PDUFA tracker
Merlintrader Trading Pub
Biotech catalyst, news and analysis PDUFA tracker
Run-Up Biotech Strategy 2025
Bilingual EN/IT report – observational framework for biotech catalysts and price action
1. Strategy concept – what is “Run-Up Biotech”
The Run-Up Biotech strategy focuses on observing and tracking how biotech stocks behave in the weeks leading up to key clinical or regulatory events, such as PDUFA decisions, top-line readouts from trials, or presentations at major medical conferences.
The objective is not to predict the outcome of the event, but to identify speculative interest and market accumulation that often appear before those dates. The core focus remains on pre-event momentum and on risk management in a sector that is structurally volatile.
2. Core framework – selection, analysis, risk
In its informational version, the strategy can be summarized across three main dimensions: stock selection, analytical approach, and risk management.
Stock selection
- Clear and dateable catalyst (PDUFA, top-line data, conference, NDA/BLA filing).
- Sustainable capital structure (reasonable float, manageable short interest).
- Adequate cash position and no obvious near-term dilutive offering.
- Sufficient average volume for transparent and liquid trading.
Analytical approach
- Monitoring of sentiment and volume patterns before the event.
- Technical analysis on trend, breakouts and key consolidations.
- Observation of corporate communication and news flow.
- Comparative view vs previous run-up cases with similar profile.
Risk management
- Strategy is strictly observational and non-predictive.
- Focus on price action and liquidity dynamics, not forecasts.
- Avoid full exposure during the main binary event when possible.
- Biotech volatility requires constant prudence and discipline.
Note: The Run-Up Biotech model is a way to observe market behavior around catalysts. It is not
an invitation to buy or sell securities and should not be treated as financial advice.
3. Objective
The practical goal of the Run-Up Biotech Strategy 2025 is to identify and follow the strength cycle of biotech names as they approach important catalysts (clinical data, PDUFA, deals, presentations) and to potentially participate in the run-up phase before the event, always with a clearly defined and conservative risk profile.
4. Synthetic methodology
- Catalyst selection: identify relevant events via official calendars and company sources.
- Fundamental context: pipeline, cash, partners, float, short interest, institutional ownership.
- Technical timing: trend structure and key levels using Medved Trader charts and Finviz screening.
- Risk management: scaling in, technical stops, position sizing aligned with volatility.
Warning: the strategy does not remove risk. Biotech stocks can gap violently on news.
Use conservative position sizes and plan exits before entering the trade.
5. Operational checklist
- Confirmed event and source (company filing, press release, official calendar).
- Defined timeframe (specific date or credible time window).
- Adequate liquidity and realistic spreads for size and style.
- Constructive trend or clear base in the making.
- Technical levels and invalidation zone identified in advance.
- Exit plan defined upfront (partial exits, stop, targets, or “out before event”).
6. Tools and data sources updated
| Tool / Site | Main role in the framework |
|---|---|
| Official company filings | Primary source for catalysts (8-K, 10-Q/10-K, press releases). |
| Merlintrader Catalyst Calendar | Internal calendar curated from official sources and sector data. |
| Seeking Alpha | Fundamental research, earnings coverage and sector news. |
| Stocktwits | Real-time sentiment and popularity of tickers among retail traders. |
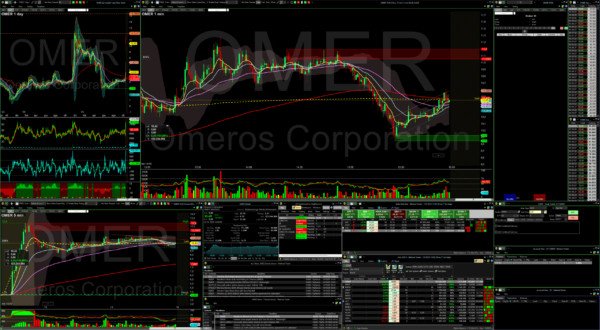
| Medved Trader | Intraday execution, multi-timeframe charting and tape reading. |
| Finviz | Daily charts, screeners, quick sector comparison and relative performance. |
| ChartsWatcher | Alerts and pattern detection when intraday activity becomes intense. |
| ClinicalTrials.gov | Official database for ongoing clinical studies and design details. |
| AI assistants (ChatGPT/Claude, etc.) | Support for synthesis, document parsing and workflow automation. |
| Merlintrader trading Blog | Collaborative summary, dashboards and tools for the community. |
7. Weekly workflow
- Monday: review catalyst calendars; identify relevant events 3–6 weeks out.
- Tue–Wed: fundamental review: pipeline, cash, short interest, recent corporate actions.
- Thursday: technical screening on Finviz and Medved Trader; identify structures and levels.
- Friday: sentiment scan on Stocktwits and news feeds; refine the weekly watchlist.
- During the week: monitor trend and volume; consider entries only when setups are confirmed.
8. Typical entry signals
- Breakout of resistance with volume expanding to 2–3x the recent average.
- Positive trend on the weekly chart and visible accumulation base.
- Improving sentiment (e.g. more constructive flow on Stocktwits).
- Confirmed catalysts at a controlled distance (often 4–8 weeks is ideal).
- Solid liquidity and implied volatility not at extreme levels.
9. Exit rules
- Profit taking: partial or full exit before the event, depending on residual risk.
- Stops: technical levels below key supports, with pre-defined maximum loss.
- Negative news: exit quickly if adverse news emerges before the expected catalyst.
- Momentum fade: reduce or exit if the trend weakens and participation dries up.
10. Essential risk management
- Position size: typically limited to a small percentage of the overall portfolio per idea.
- No aggressive leverage on highly volatile biotech names.
- Diversification: avoid concentrating risk on one or two binary events.
- Stops and exits planned before entering, not after the fact.
- Capital protection over time is more important than win rate on single trades.
Reminder: Run-up biotech is a tactic, not a guaranteed system. Discipline and risk
management matter more than any single trade outcome. Protecting capital remains the first priority.
Sources and references
This strategy summary is based on public information from official company filings, FDA documents and calendars, clinical trial registries, and major financial news outlets, combined with direct observation of price behavior around catalysts over recent years.
- Company investor relations pages and SEC/official filings.
- FDA communications and drug approval or advisory committee calendars.
- ClinicalTrials.gov and similar official registries.
- Primary news feeds from reputable financial media.
1. Concetto della strategia – cos’è il “Run-Up Biotech”
La strategia Run-Up Biotech osserva e monitora il comportamento dei titoli biotech nelle settimane che precedono eventi clinici o regolatori rilevanti, come decisioni PDUFA, letture top-line di studi o presentazioni a conferenze mediche di rilievo.
L’obiettivo non è prevedere l’esito dell’evento, ma individuare l’interesse speculativo e l’eventuale accumulo di mercato che spesso anticipano tali date. Il focus rimane sul momentum pre-evento e sulla gestione del rischio in un settore strutturalmente volatile.
2. Struttura di base – selezione, analisi, rischio
Nella sua versione informativa, la strategia può essere riassunta in tre dimensioni principali: selezione dei titoli, approccio analitico e gestione del rischio.
Selezione dei titoli
- Catalyst chiaro e databile (PDUFA, top-line, conferenza, deposito NDA/BLA).
- Struttura azionaria sostenibile (float ragionevole, short interest gestibile).
- Situazione finanziaria adeguata e assenza di aumenti di capitale imminenti.
- Volume medio sufficiente per un mercato liquido e trasparente.
Approccio analitico
- Monitoraggio del sentiment e dei volumi nella fase pre-evento.
- Analisi tecnica su trend, breakout e consolidamenti chiave.
- Osservazione della comunicazione aziendale e del flusso news.
- Valutazione comparativa con precedenti casi di run-up simili.
Gestione del rischio
- Strategia puramente osservativa, non predittiva.
- Focus sulla price action e sulle dinamiche di liquidità, non sulle previsioni.
- Tendenziale evitamento dell’esposizione piena durante l’evento binario.
- La volatilità biotech richiede sempre prudenza e disciplina.
Nota: il modello Run-Up Biotech è uno schema di osservazione del mercato intorno ai catalyst.
Non rappresenta un invito ad acquistare o vendere titoli e non va interpretato come consulenza finanziaria.
3. Obiettivo
Lo scopo pratico della Strategia Run-Up Biotech 2025 è individuare e seguire il ciclo di forza dei titoli biotech nella fase di avvicinamento ai principali catalyst (dati clinici, PDUFA, accordi, presentazioni) e, se opportuno, partecipare alla fase di run-up prima dell’evento, mantenendo sempre un profilo di rischio chiaro e conservativo.
4. Metodologia sintetica
- Selezione dei catalyst: identificazione eventi rilevanti da calendari ufficiali e fonti societarie.
- Contesto fondamentale: pipeline, cassa, partner, float, short interest, presenza istituzionale.
- Timing tecnico: struttura del trend e livelli chiave con grafici Medved Trader e screening Finviz.
- Gestione del rischio: ingressi scalari, stop tecnici, size coerente con la volatilità.
Avvertenza: la strategia non elimina il rischio. I titoli biotech possono
aprire in gap violenti sulle news. È fondamentale usare size conservative e pianificare l’uscita
prima dell’ingresso.
5. Checklist operativa
- Evento atteso confermato da fonte ufficiale (filing, comunicato, calendario).
- Timeframe definito (data precisa o finestra temporale credibile).
- Liquidità adeguata e spread compatibili con la propria operatività.
- Trend costruttivo o base di accumulo in formazione.
- Livelli tecnici e zona di invalidazione chiari in anticipo.
- Piano di uscita predefinito (parziali, stop, target, o uscita prima dell’evento).
6. Strumenti e fonti aggiornati
| Strumento / Sito | Ruolo principale nella strategia |
|---|---|
| Filing societari ufficiali | Sorgente primaria per catalyst (8-K, 10-Q/10-K, comunicati stampa). |
| Calendario Catalyst Merlintrader | Calendario interno costruito da fonti ufficiali e dati di settore. |
| Seeking Alpha | Ricerca fondamentale, copertura delle trimestrali e news di settore. |
| Stocktwits | Sentiment in tempo reale e popolarità dei ticker tra i trader retail. |
| Medved Trader | Piattaforma per esecuzione intraday, grafici multi-timeframe e lettura del flusso ordini. |
| Finviz | Grafici daily, screener, confronto rapido tra titoli e settori. |
| ChartsWatcher | Scanner e sistema di allerta per movimenti intraday forti. |
| ClinicalTrials.gov | Database ufficiale dei trial clinici in corso e dei relativi dettagli. |
| AI assistant (ChatGPT/Claude, ecc.) | Supporto per sintesi, lettura documenti e automazione del flusso operativo. |
| Merlintrader trading Blog | Sintesi, dashboard e strumenti condivisi per la community. |
7. Workflow settimanale
- Lunedì: consultare i calendari catalyst; identificare eventi rilevanti a 3–6 settimane.
- Martedì–Mercoledì: analisi fondamentale: pipeline, cassa, short interest, azioni societarie recenti.
- Giovedì: screening tecnico su Finviz e Medved Trader; individuare strutture e livelli.
- Venerdì: analisi del sentiment su Stocktwits e flussi news; affinare la watchlist settimanale.
- Durante la settimana: monitoraggio di trend e volumi; valutare ingressi solo con setup confermati.
8. Segnali di entrata tipici
- Breakout di resistenza con volumi in crescita (2–3x la media recente).
- Trend positivo sul grafico settimanale e base di accumulo visibile.
- Sentiment in miglioramento (es. flusso più costruttivo su Stocktwits).
- Catalyst confermati a distanza temporale controllata (spesso 4–8 settimane sono una fascia ideale).
- Buona liquidità e volatilità implicita non a livelli estremi.
9. Regole di uscita
- Presa di profitto: uscita parziale o totale prima dell’evento, in base al rischio residuo.
- Stop loss: livelli tecnici sotto supporti chiave, con perdita massima pre-definita.
- News negative: uscita rapida se emergono notizie avverse prima del catalyst atteso.
- Perdita di momentum: riduzione o uscita se il trend si indebolisce e la partecipazione cala.
10. Risk management essenziale
- Dimensione posizione: quota limitata del portafoglio per singola idea.
- Evitare leva aggressiva su titoli biotech molto volatili.
- Diversificazione: non concentrare il rischio su uno o due eventi binari.
- Stop e modalità di uscita pianificati prima dell’ingresso, non ex post.
- La protezione del capitale nel tempo è più importante del tasso di successo sul singolo trade.
Promemoria: il run-up biotech è una tattica, non un sistema garantito. Disciplina e gestione
del rischio contano più dell’esito del singolo trade. La priorità resta proteggere il capitale.
Fonti e riferimenti
Questa sintesi di strategia si basa su informazioni pubbliche provenienti da filing societari ufficiali, documenti e calendari FDA, registri dei trial clinici e principali testate finanziarie, combinate con l’osservazione diretta del comportamento dei prezzi intorno ai catalyst negli ultimi anni.
- Pagine investor relations e filing ufficiali delle società.
- Comunicazioni FDA e calendari di approvazione o advisory committee.
- ClinicalTrials.gov e registri ufficiali equivalenti.
- Flussi news delle principali testate finanziarie internazionali.
Biotech Catalyst Calendar
To explore upcoming FDA decisions, clinical readouts and key biotech events followed in this strategy,
you can refer to the dedicated calendar page on Merlintrader trading Blog.
Open the Biotech Catalyst Calendar